

Bitcoin Tumbles Below 60,000 Mark, Is It an Epic Dip-Buying Opportunity Now?
TradingKey - On June 5, Bitcoin ( BTC) prices fell below $60,000, hitting a two-year low; meanwhile, the market sentiment index dropped below 20, falling into extreme fear. Facing this carnage, crypto investors are holding their breath over two questions: Is this the final epic 'golden pit' of this cycle, or the start of a deeper downward spiral? Is now the time to buy the dip?
Bitcoin Historical Price Trends
On June 5, Bitcoin's price fell to a low of $59,343, breaking below the $60,000 support level set in February and touching a low last seen in October 2024. Compared to the all-time high of $125,000 reached last October, Bitcoin has seen a cumulative decline of 53%.
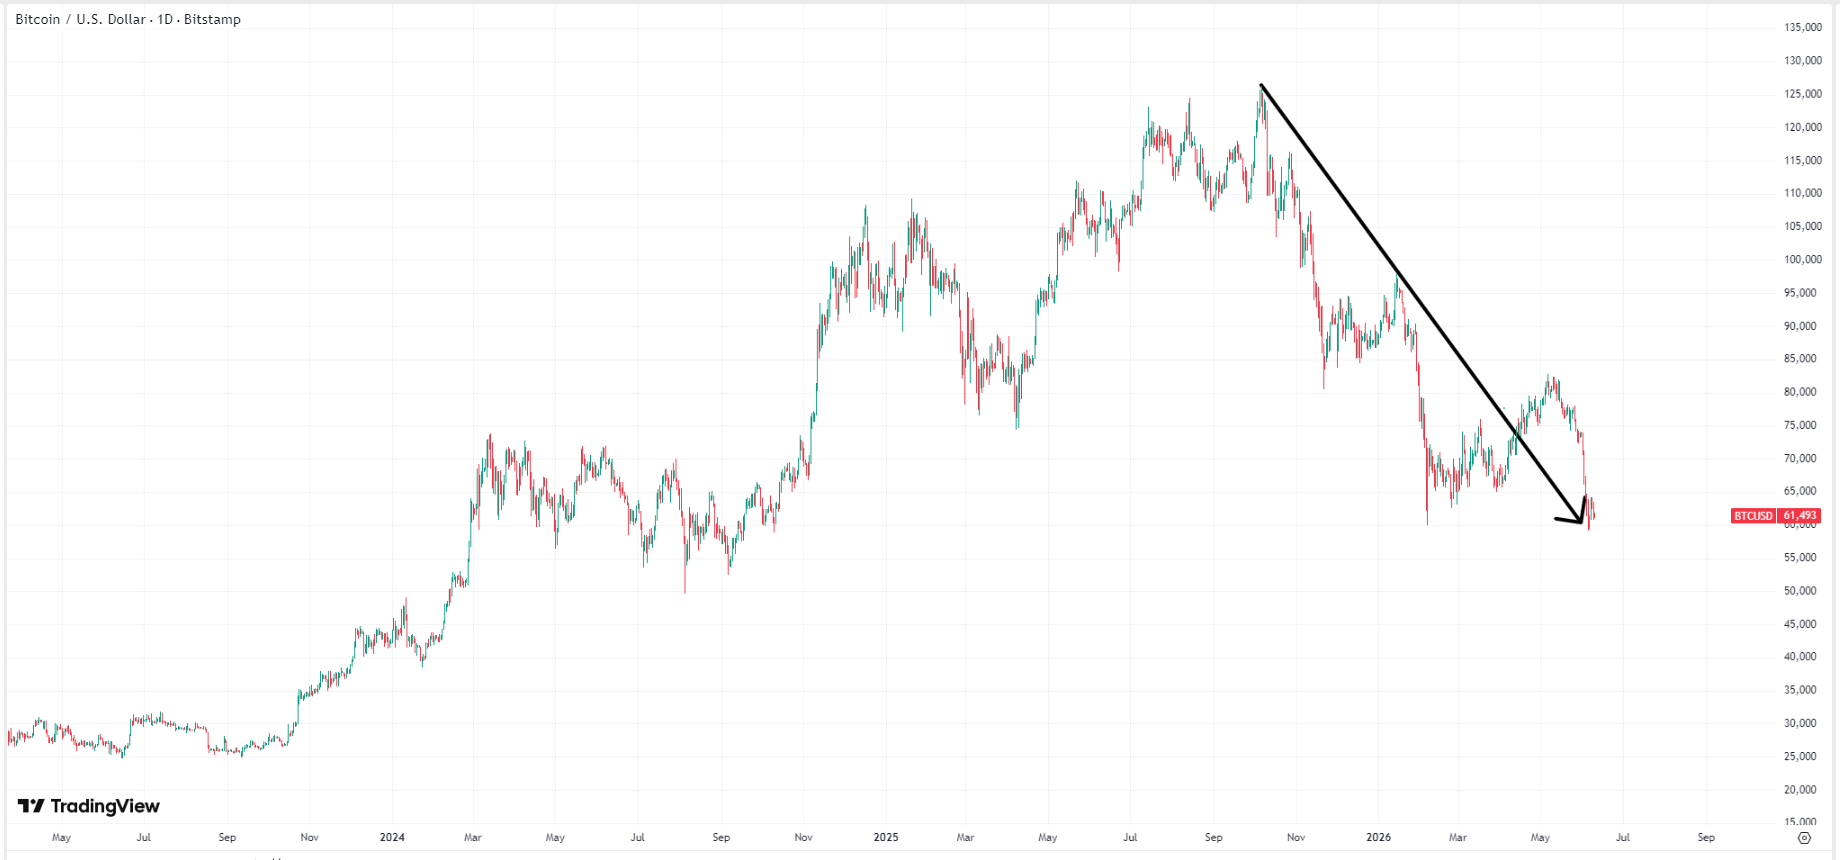 Bitcoin price chart, Source: TradingView
Historically, Bitcoin drawdowns exceeding 50% are not uncommon. Given its nature as a high-beta (high-volatility) asset, such sharp fluctuations occur in nearly every halving cycle, during macro deleveraging, or following systemic black swan events. Classic examples include the 2011 Mt. Gox incident, the 2013 Cyprus crisis, the 2018 ICO bubble, the 2020 pandemic, the 2021 China mining crackdown, and the 2021 FTX collapse.
In these events, Bitcoin’s decline typically stayed within the 70%-90% range, leading to prolonged bear markets; however, in 2020 and 2021, the price stabilized after a mere 50% drop and even rebounded to hit new highs. Which script will Bitcoin follow this time?
Bitcoin Price Prediction: Will it fall further?
According to historical data, Bitcoin bear markets typically occur in the second year after a halving, with prices continuing to fall after peaking in that year. As we enter 2026, which is exactly the second year after 2024, it means the crypto market is highly likely entering a bear market.
Correction Cycle | All-Time High | Cycle Low | Maximum Drawdown |
|---|---|---|---|
2014 | Approx. $1,163 | Approx. $152 | -86.9% |
2018 | Approx. $19,800 | Approx. $3,120 | -84.2% |
2022 | Approx. $69,000 | Approx. $15,470 | -77.5% |
2026 | TBD | TBD | TBD |
If the decline in this bear market matches previous ones, Bitcoin's price could fall further. Based on a 70%-80% decline and a peak price of $126,000, Bitcoin's price could potentially drop to $30,000-$40,000 in the future. Currently, Grayscale also leans toward the view that Bitcoin may not have bottomed out yet. On June 9, its head of research, Zach Pandl, stated that on-chain valuation metrics show Bitcoin is currently undervalued, but has not reached the level of cheapness seen at previous cycle bottoms.
Is now the time to buy Bitcoin?
Based on historical bear market drawdown data and insights from Grayscale, Bitcoin prices may face further declines; however, this is not definitive, and the price could also stabilize. If the current crypto market breaks the historical cycle of a "bear market two years after the halving" and mirrors the price action of 2020 and 2021, it would indicate that Bitcoin is currently at a local bottom, potentially followed by a rally to new highs.
Currently, there is no evidence suggesting Bitcoin is certain to fall, nor is there proof of an inevitable rise. Consequently, in the face of such uncertainty, investors should avoid "all-in" or "all-cash" strategies. Instead, a phased accumulation approach is more appropriate.
Capital intended for buying the dip can be divided into four or five portions, with an initial defensive position established near $61,000. Remaining limit orders should be distributed evenly at $55,000, $40,000, and $30,000 in the event of extreme liquidations. Most importantly, avoid leverage and short-term volatility; instead, use time to gain perspective and wait for macroeconomic headwinds to clear and the next major cycle to recover.
Nothing in this material constitutes investment advice, personal recommendation, investment research, an offer, or a solicitation to buy or sell any financial instrument. The content has been prepared without consideration of your individual investment objectives, financial situation, or needs, and should not be treated as such.
Past performance is not a reliable indicator of future performance and/or results. Forward-looking scenarios or forecasts are not a guarantee of future performance. Actual results may differ materially from those anticipated.
Mitrade makes no representation or warranty as to the accuracy or completeness of the information provided and accepts no liability for any loss arising from reliance on such information.
Recommended Articles


