

Dell Stock Forecast: $51.3B Backlog Fuels Rebound as DELL Reclaims $412 — Can It Reach $448?
TradingKey - As of today, June 15, Dell (DELL) is trading at $412.31, after bouncing off EMA50 ($392.05) on the 1H chart on green candles with volume on June 13 when the stock tested this level on June 13 at $398.94. RSI is up from neutral 54 to 57 as of June 13 to now 66.42, near overbought, within the 48-hour window of this setup. A higher level of support lies ahead in EMA200 at $378.58.
The first overhead resistance is found in the $407 to $430 zone, capping the immediate range within the blue descending channel from the $465 high. The fundamentals driving the bounce are unchanged, with Q1 FY2027 revenue of $43.8B at +88% YoY growth, $51.3B in record order backlog, guidance raised to FY2027 full-year of $165 to $169B and a fresh $9.7B in new government contracts to offset hyperscaler reliance. The June 16 to 17 Warsh FOMC is the main macro event on the near-term horizon.
From $398 to $412 in 48 Hours — What the EMA50 Reclaim Signals
The price action from $398.94 on June 13 to today’s $412.31 is 3.4% price rise over 48 hours, after EMA50 was tested on a recent day. That move alone doesn’t amount to much, but it aligns with what the June 13 setup was positioned to capture: EMA50 holding at $390.97, the mixed candlesticks with long wicks indicating buyers were absorbing supply in the support zone, then a follow-through in reclaim on the 1H timeframe with expansion in volume as confirmation that price held there. RSI moving from neutral 54 to 57 as of June 13 to 66.42, now nearing overbought, confirms that buyers who entered at EMA50 were forceful with their buys. Otherwise we wouldn’t see such a robust rise in RSI instead of a more gradual recovery in RSI.
The chart is now setting up as the next test of resistance comes in the $407 to $430 range inside the descending blue channel, as EMA50 has moved behind price and become a support level rather than a ceiling at resistance. RSI is at 66.42, now near overbought; a bounce and breakout may need a short-term pullback to digest the gains and trade inside the resistance zone, or the momentum generated by the backlog and new government contract data may be enough to drive price through resistance on the first attempt at resistance.
The June 16 to 17 Warsh FOMC is a macro variable in that it might drive price lower toward resistance and back RSI to neutral on hawkish news, or drive price higher toward resistance and beyond if it’s priced as neutral or dovish.
Why the $9.7 Billion Government Contract Win Changes the Risk Profile
Though Dell's current backlog totals $51.3 billion, the fresh $9.7 billion of government contracts is a quality upgrade to Dell's risk profile that warrants closer inspection. The spending cycle of hyperscalers (Microsoft, Google, Amazon, Meta) on the AI server infrastructure that underpins Dell's ISG revenues is volatile and subject to the timing of AI returns on investment, competitive dynamics and broader tech spend conditions. So if hyperscaler AI spending slowed sharply, Dell's hyperscaler dominated backlog could be under pressure for contraction even as revenues continue to convert from current bookings.
However, Dell's government IT upgrade agreements cycle quite differently: the cycle of government procurement takes many years to complete, the IT upgrade decision cycle is driven by government policy decisions and operational requirements rather than arguments about the ROI of AI, and the government customer is less likely to cancel agreements compared to the commercial market.
With Dell projecting $60 billion in AI server revenues by fiscal 2027 plus $9.7 billion of government contracts in the current backlog, the two cycle mix helps diversify Dell's cash flow outlook and adds some stability. There is still risk here from hyperscaler capex (the primary downside case to watch) but some of Dell's backlog should continue to convert to revenues through the 2nd half of 2026 in a way that is less impacted by hyperscaler AI capex swings. For the investor facing macro uncertainty over the next few weeks ahead of the Fed's FOMC meeting, this type of fundamental diversification is the type of quality factor that can make the case for owning the stock during turbulent times.
DELL Technical Setup — EMA50 Reclaimed at $412, Resistance $430, Target $447.80
DELL price action on the one-hour timeframe remains positive as DELL trades at $412.31. It recently reclaimed the 50 day EMA at $392.05 and has continued to rally on green candle bodies with surging volume and a series of higher lows forming above the black rising trend line confluence. DELL's longer term structure is anchored at the 200 EMA at $378.58. The RSI at 66.42 is nearing overbought territory with price momentum healthy, but no bearish divergence yet.
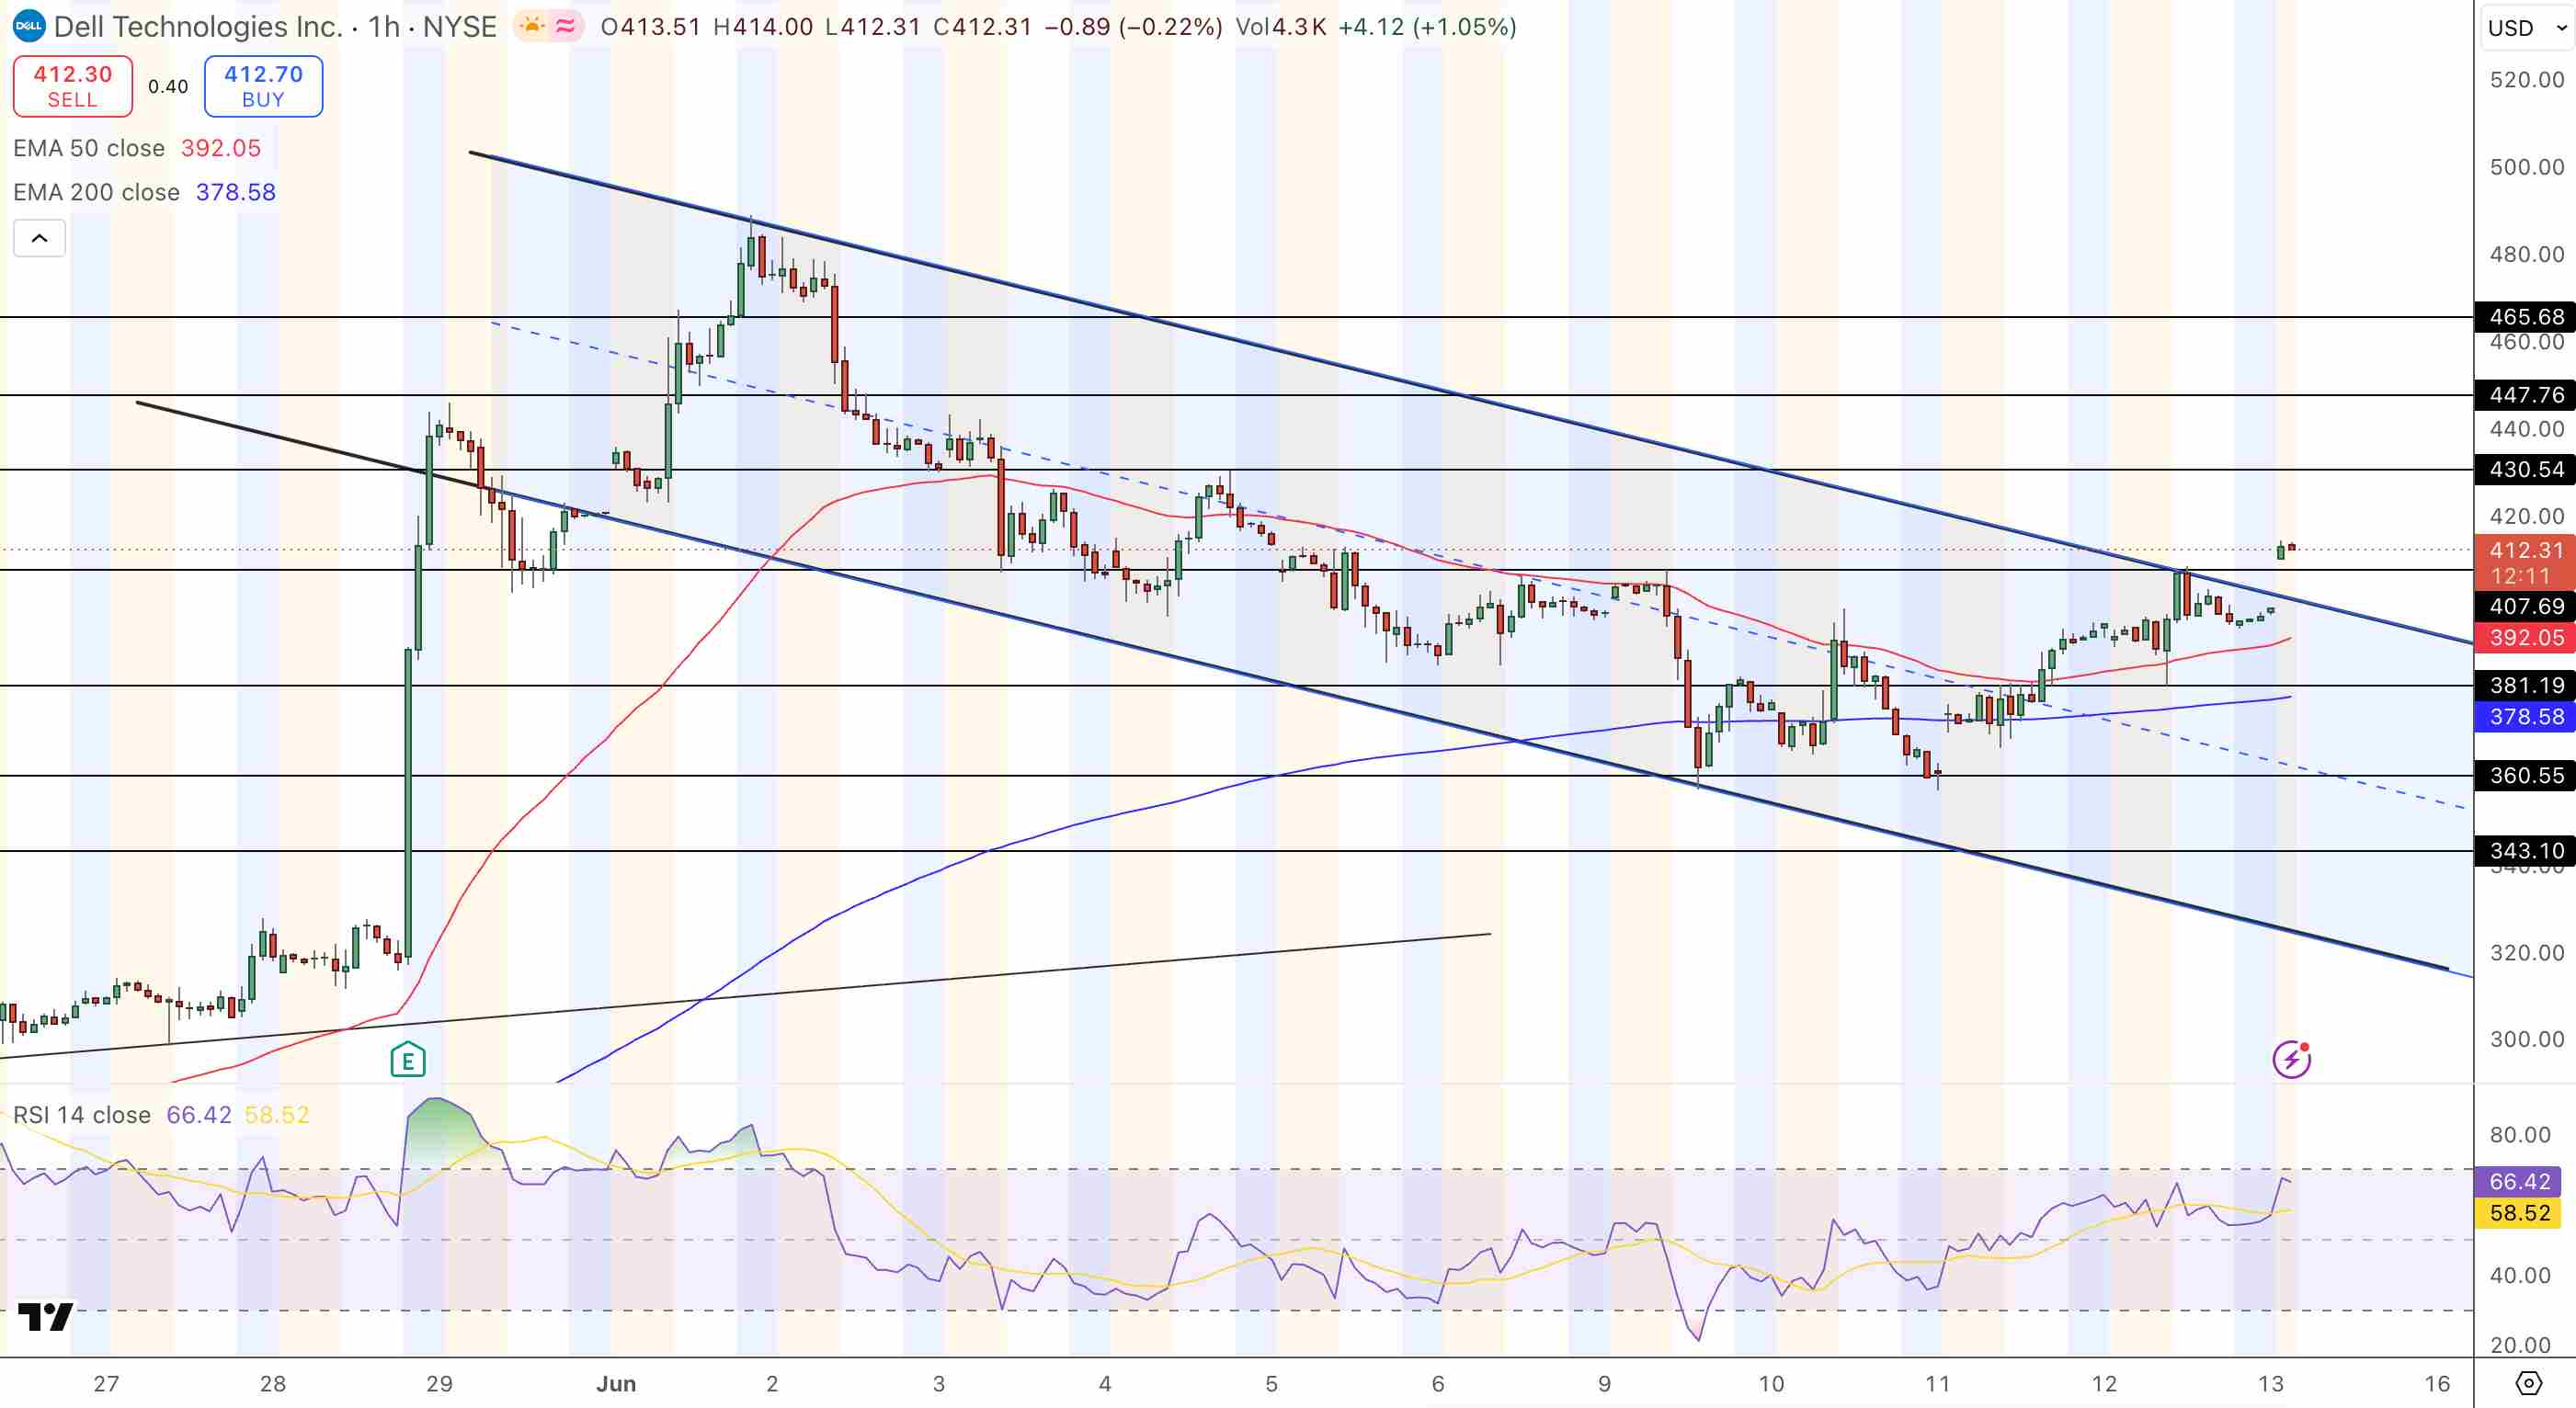
Overhead resistance sits at $407 to $430 from the descending blue channel. A break of $430.50 leads to $447.80 on the EMA50 extension; last high is $465 with the top of the channel at this point higher than that. I have a stop loss on under $392.00 on this trade. $392 is the current dynamic support level on the 50 day EMA.
- Entry: Long above $430.50, breakdown resistance of the descending channel is overcome
- Target 1: $447.80, EMA50 breakout extension
- Target 2: $465, the previous high, as well as the top of the channel
- Support: $392.00, the dynamic support provided by the 50-day EMA
- Stop Loss: A daily close below $392.00 would signal a failed reclamation of the 50-day EMA
- Macro Risk: The Fed’s FOMC meeting on June 16th/17th (Warsh), a hawkish signal might block the breakout of the descending channel
The Bottom Line
Dell moved from $398.94 to $412.31 in 48 hours after it held the EMA50 on the 13th with an RSI moving from neutral 54 to 57 and now 66.42 approaching overbought which is a sign that buyers at the EMA50 were institutional buyers instead of retail dipping the water.
And with government contracts accounting for $9.7 billion of its $51.3 billion backlog, Dell (DELL) now has a revenue growth from dual-cyclics (government vs hyperscalers) providing it diversification from the hyperscalers.
The next technical overhead is Dell (DELL) channel resistance at $407 to $430 with the upper trendline target $447.80 and a stop loss of $392.00. And finally, the Warsh FOMC (June 16th to 17th) creates binary risk for the breakout with a hawkish read keeping it from breaking the channel resistance and a neutral or dovish read clearing a path.
Nothing in this material constitutes investment advice, personal recommendation, investment research, an offer, or a solicitation to buy or sell any financial instrument. The content has been prepared without consideration of your individual investment objectives, financial situation, or needs, and should not be treated as such.
Past performance is not a reliable indicator of future performance and/or results. Forward-looking scenarios or forecasts are not a guarantee of future performance. Actual results may differ materially from those anticipated.
Mitrade makes no representation or warranty as to the accuracy or completeness of the information provided and accepts no liability for any loss arising from reliance on such information.
Recommended Articles


