

Bitcoin Price Forecast: BTC extends rebound as US and Iran reach framework deal to end the war
- Bitcoin steadies at $65,700 on Monday after recovering nearly 4% in the previous week.
- Risk-on sentiment boosted slightly following the announcement that the US and Iran have reached a preliminary peace deal.
- Despite the recovery, institutional demand remains weak, with US spot Bitcoin ETFs posting a fifth consecutive week of outflows.
Bitcoin (BTC) steadies above $65,700 at the time of writing on Monday, after recovering nearly 4% in the previous week. BTC recovery was boosted following Sunday’s news that the US and Iran have reached a preliminary peace deal, lifting the risk appetite. However, institutional demand continued to weaken, with spot Exchange Traded Funds (ETFs) recording the fifth consecutive week of outflows since mid-May. The Crypto King’s recovery could only be strengthened if institutional demand for BTC increases this week.
US-Iran preliminary peace deal boosts BTC recovery
The US and Iran reached a preliminary peace deal on Sunday, boosting risk-on sentiment across markets.
Iran’s Supreme National Security Council confirmed Sunday that Tehran had finalized a Memorandum of Understanding (MoU), saying all military operations on all fronts, including Lebanon, would cease “immediately and permanently”, CNBC reported.
On the US front, US President Donald Trump said in a post on Truth Social, “I hereby fully authorize the toll-free opening of the Strait of Hormuz, and, simultaneously herewith, authorize the immediate removal of the United States Naval blockade.”
Meanwhile, Pakistan Prime Minister (PM) Shehbaz Sharif has stated in a post on X that the finalized MoU between the US and Iran will be signed this Friday in Switzerland.
Iran’s Deputy Foreign Minister, Kazem Gharibabadi, said a more expansive agreement would be negotiated during a 60-day ceasefire period, including sanctions relief for Iran.
The fate of Iran’s nuclear program, another thorny issue, will also be addressed in those later talks, reported Reuters.
The easing of geopolitical tensions boosted demand for risk assets, such as Bitcoin, which closed the week positive, with a 3.8% gain, and is hovering above $65,700 as of writing on Monday.
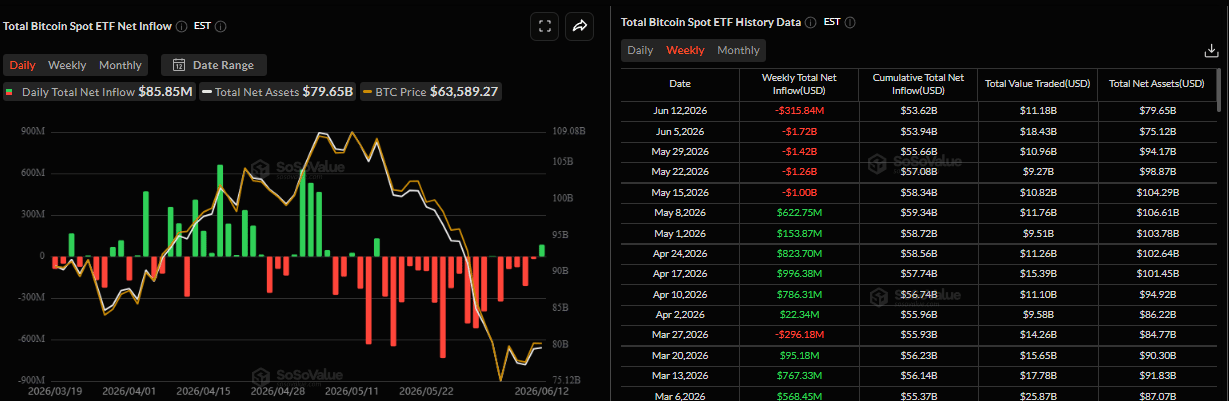
Institutional selling continues
Institutional demand continues to weaken. SoSoValue weekly data show that spot BTC ETFs recorded an outflow of $315.84 million last week, marking the fifth consecutive week of withdrawals, signaling weakening institutional demand and potentially leading to a price decline. If this trend continues, BTC could see further correction this week.
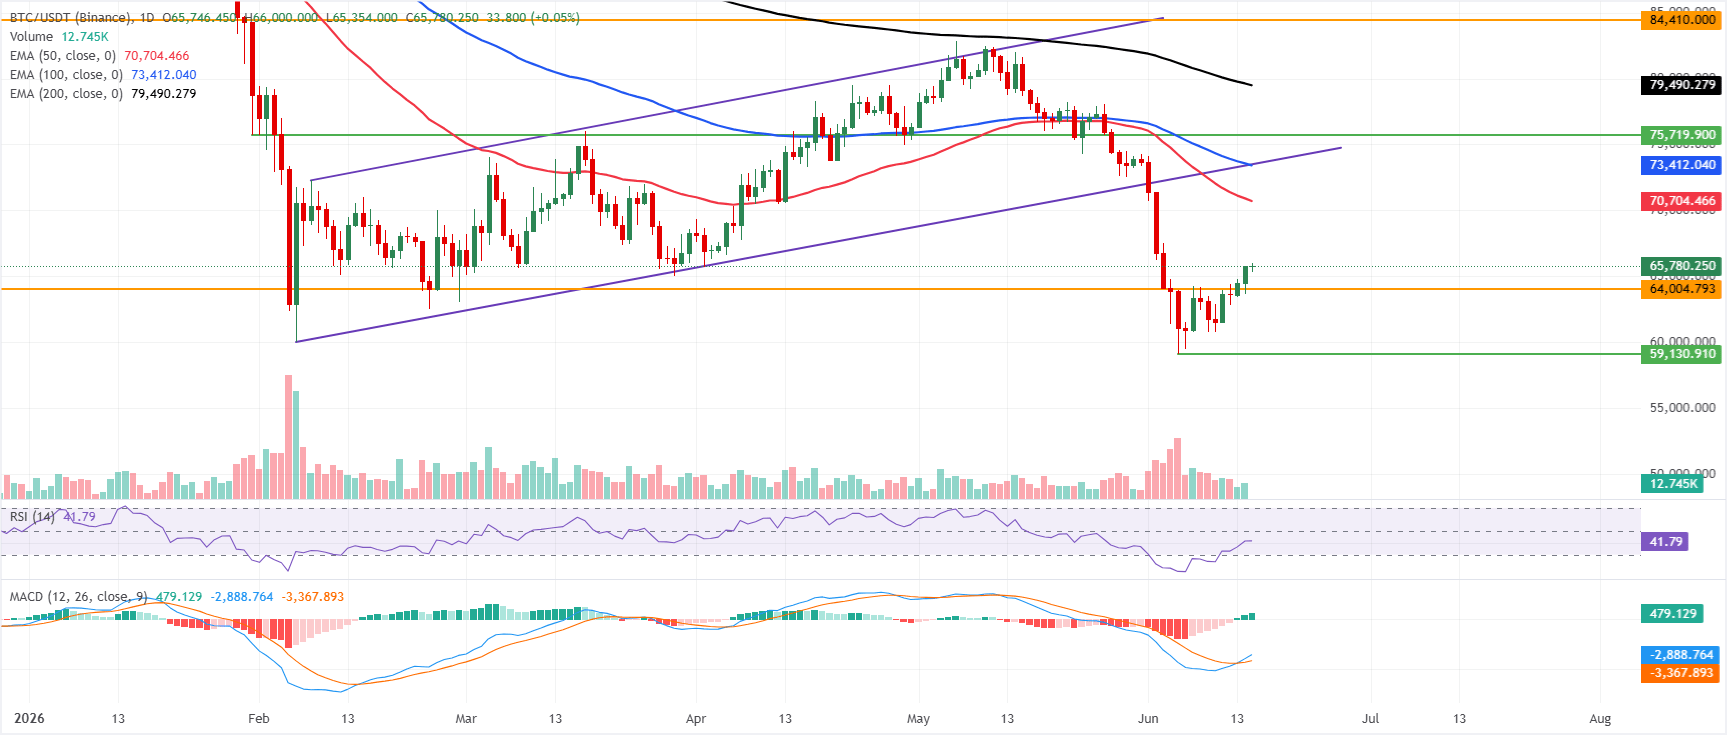
Bitcoin Price Forecast: Waning downside momentum
Bitcoin price trades at $65,700 after recovering nearly 4% in the previous week. However, BTC maintains a bearish near-term bias as price remains well below the 50-day, 100-day, and 200-day Exponential Moving Averages (EMAs) and the previously broken ascending trendline. While the Moving Average Convergence Divergence (MACD) has flipped positive and the Relative Strength Index (RSI) on the daily chart hovers around 41, suggesting waning downside momentum, the dominant structure still points to a capped market under multiple layers of overhead resistance.
On the topside, initial resistance aligns with the 50-day EMA near $70,704, followed by the 100-day EMA at about $73,412 and the former uptrend support-turned-resistance around $73,505, forming a dense supply zone. Above that, the 200-day EMA at roughly $79,490 comes next, followed by a more distant horizontal barrier at $84,410.
On the downside, the first notable support is the horizontal level at $64,004, where a break would reopen the path toward deeper corrective losses despite the current attempts to stabilize momentum.
(The technical analysis of this story was written with the help of an AI tool.)
Bitcoin, altcoins, stablecoins FAQs
Bitcoin is the largest cryptocurrency by market capitalization, a virtual currency designed to serve as money. This form of payment cannot be controlled by any one person, group, or entity, which eliminates the need for third-party participation during financial transactions.
Altcoins are any cryptocurrency apart from Bitcoin, but some also regard Ethereum as a non-altcoin because it is from these two cryptocurrencies that forking happens. If this is true, then Litecoin is the first altcoin, forked from the Bitcoin protocol and, therefore, an “improved” version of it.
Stablecoins are cryptocurrencies designed to have a stable price, with their value backed by a reserve of the asset it represents. To achieve this, the value of any one stablecoin is pegged to a commodity or financial instrument, such as the US Dollar (USD), with its supply regulated by an algorithm or demand. The main goal of stablecoins is to provide an on/off-ramp for investors willing to trade and invest in cryptocurrencies. Stablecoins also allow investors to store value since cryptocurrencies, in general, are subject to volatility.
Bitcoin dominance is the ratio of Bitcoin's market capitalization to the total market capitalization of all cryptocurrencies combined. It provides a clear picture of Bitcoin’s interest among investors. A high BTC dominance typically happens before and during a bull run, in which investors resort to investing in relatively stable and high market capitalization cryptocurrency like Bitcoin. A drop in BTC dominance usually means that investors are moving their capital and/or profits to altcoins in a quest for higher returns, which usually triggers an explosion of altcoin rallies.
Nothing in this material constitutes investment advice, personal recommendation, investment research, an offer, or a solicitation to buy or sell any financial instrument. The content has been prepared without consideration of your individual investment objectives, financial situation, or needs, and should not be treated as such.
Past performance is not a reliable indicator of future performance and/or results. Forward-looking scenarios or forecasts are not a guarantee of future performance. Actual results may differ materially from those anticipated.
Mitrade makes no representation or warranty as to the accuracy or completeness of the information provided and accepts no liability for any loss arising from reliance on such information.
Recommended Articles


