



Zcash vs Monero: ZEC outpaces XMR despite cooling retail demand
- Privacy coins Zcash and Monero are testing their recovery potential as futures Open Interest remains relatively subdued.
- Zcash trades firmly above $460, underpinned by an emerging bullish shift with momentum indicators uptrending.
- Monero holds slightly above $320 but struggles to extend gains as the 200 EMA caps the upside.
Privacy-focused coins Zcash (ZEC) and Monero (XMR) exhibit a wide range of recovery signs on Friday, as bulls tighten their grip following weeks of extended declines. ZEC hovers above $460, marking three straight days of gains, while XMR moderates gains above $320.
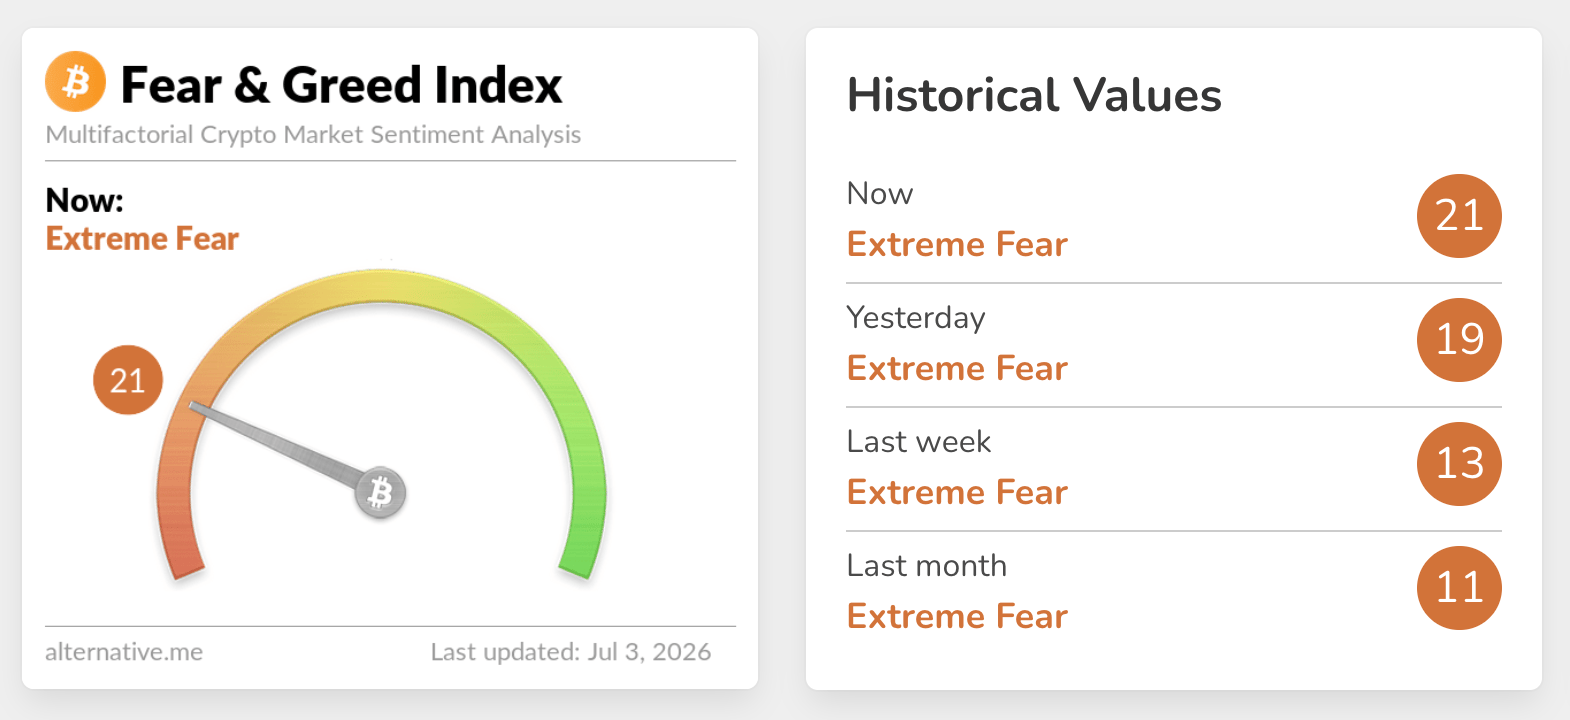
The broader crypto market’s recovery is grounded in improving sentiment. Appetite for risk assets has improved, evidenced by the Fear & Greed Index, which is embedded in the Fear Territory at 21 on Friday, after rising only marginally from 19 the day before and June’s average at 11. Steady growth in risk-on sentiment is critical to stabilizing the market and supporting short to medium-term gains.
Zcash, Monero struggle to attract retail buyers
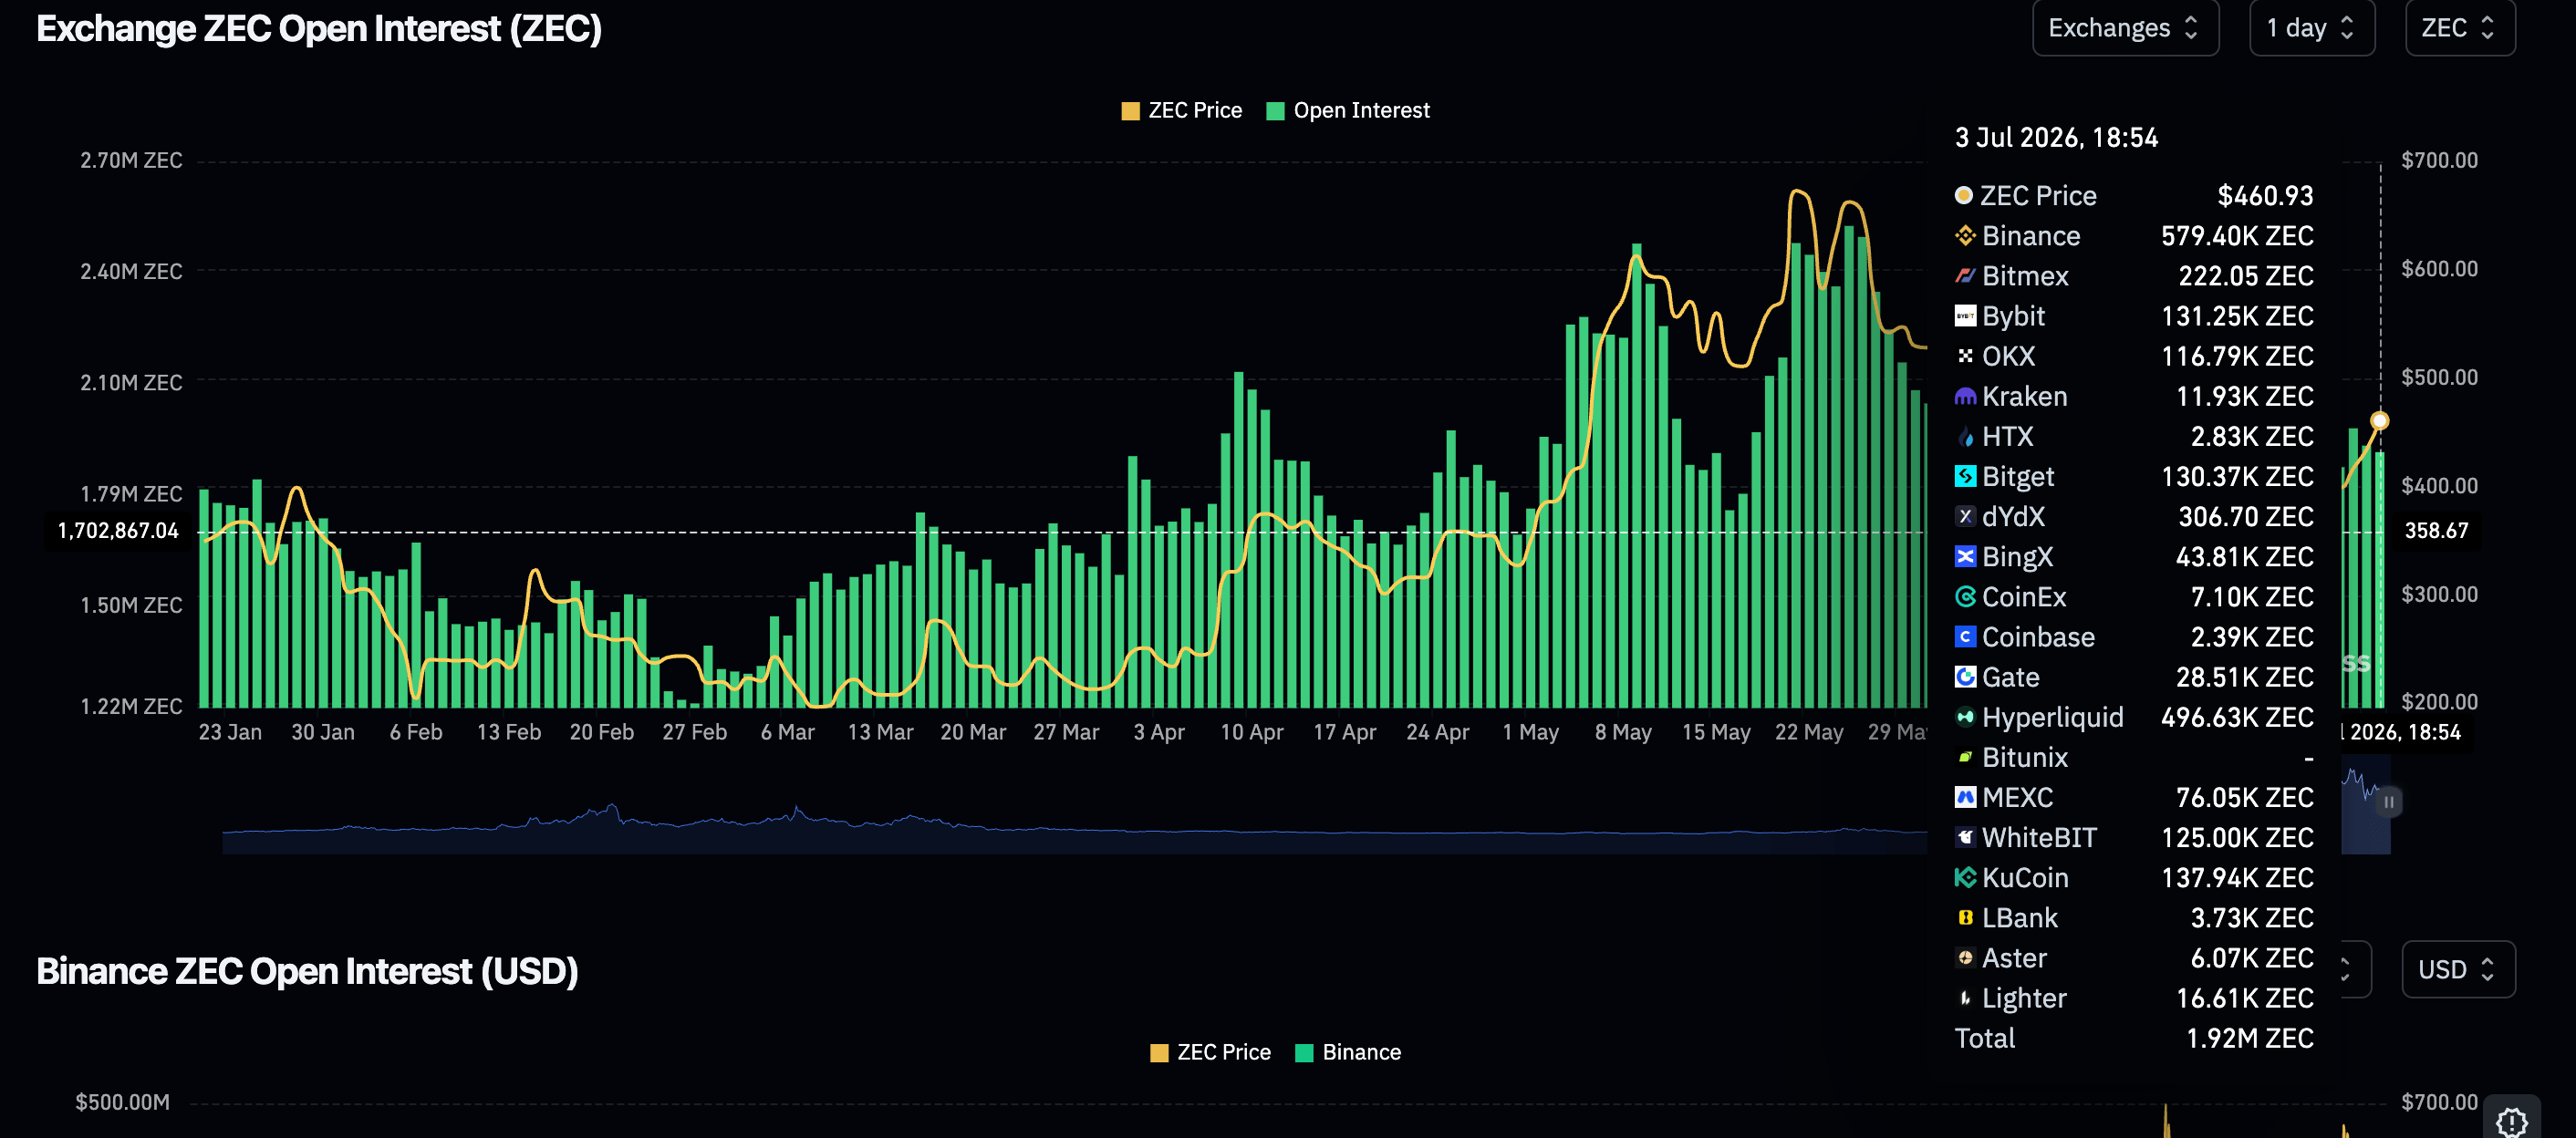
Interest in privacy coins remains generally low despite the broad price increases this week. CoinGlass data show that perpetual Open Interest (OI) declined to 1.92 million ZEC on Friday, down from 1.93 million ZEC the previous day. A wider scope highlights a steep drawdown from 2.38 million ZEC recorded on June 16, while further cooling could limit Zcash’s recovery potential.
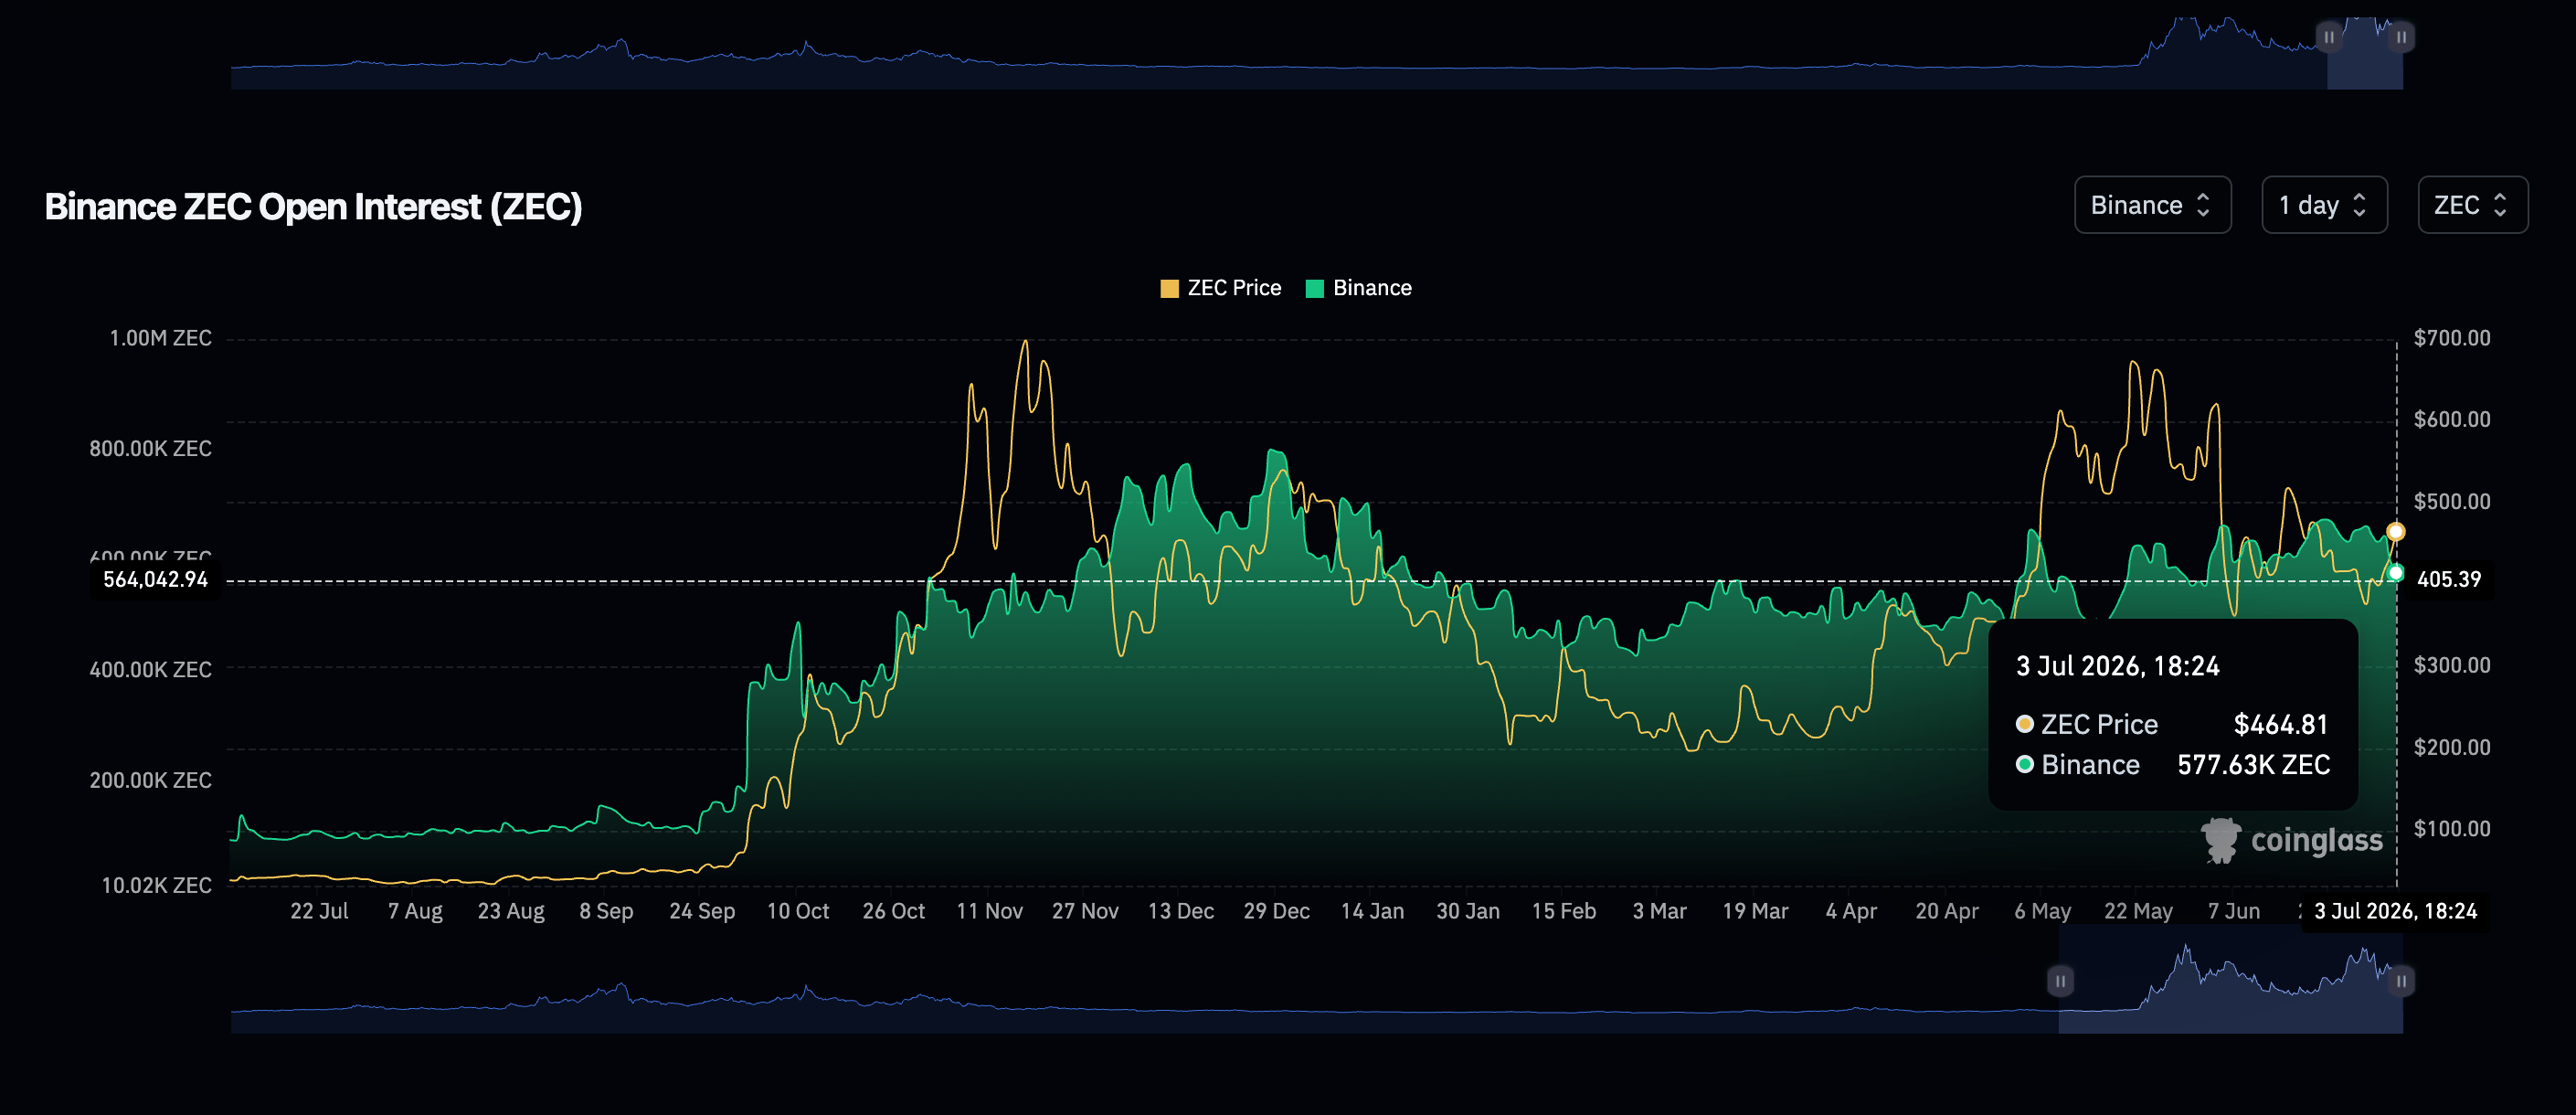
Zcash OI on Binance mirrors the overall drop, suggesting weak retail conviction in the recovery. The OI averages 578,000 ZEC, down from 601,000 ZEC in the same period.
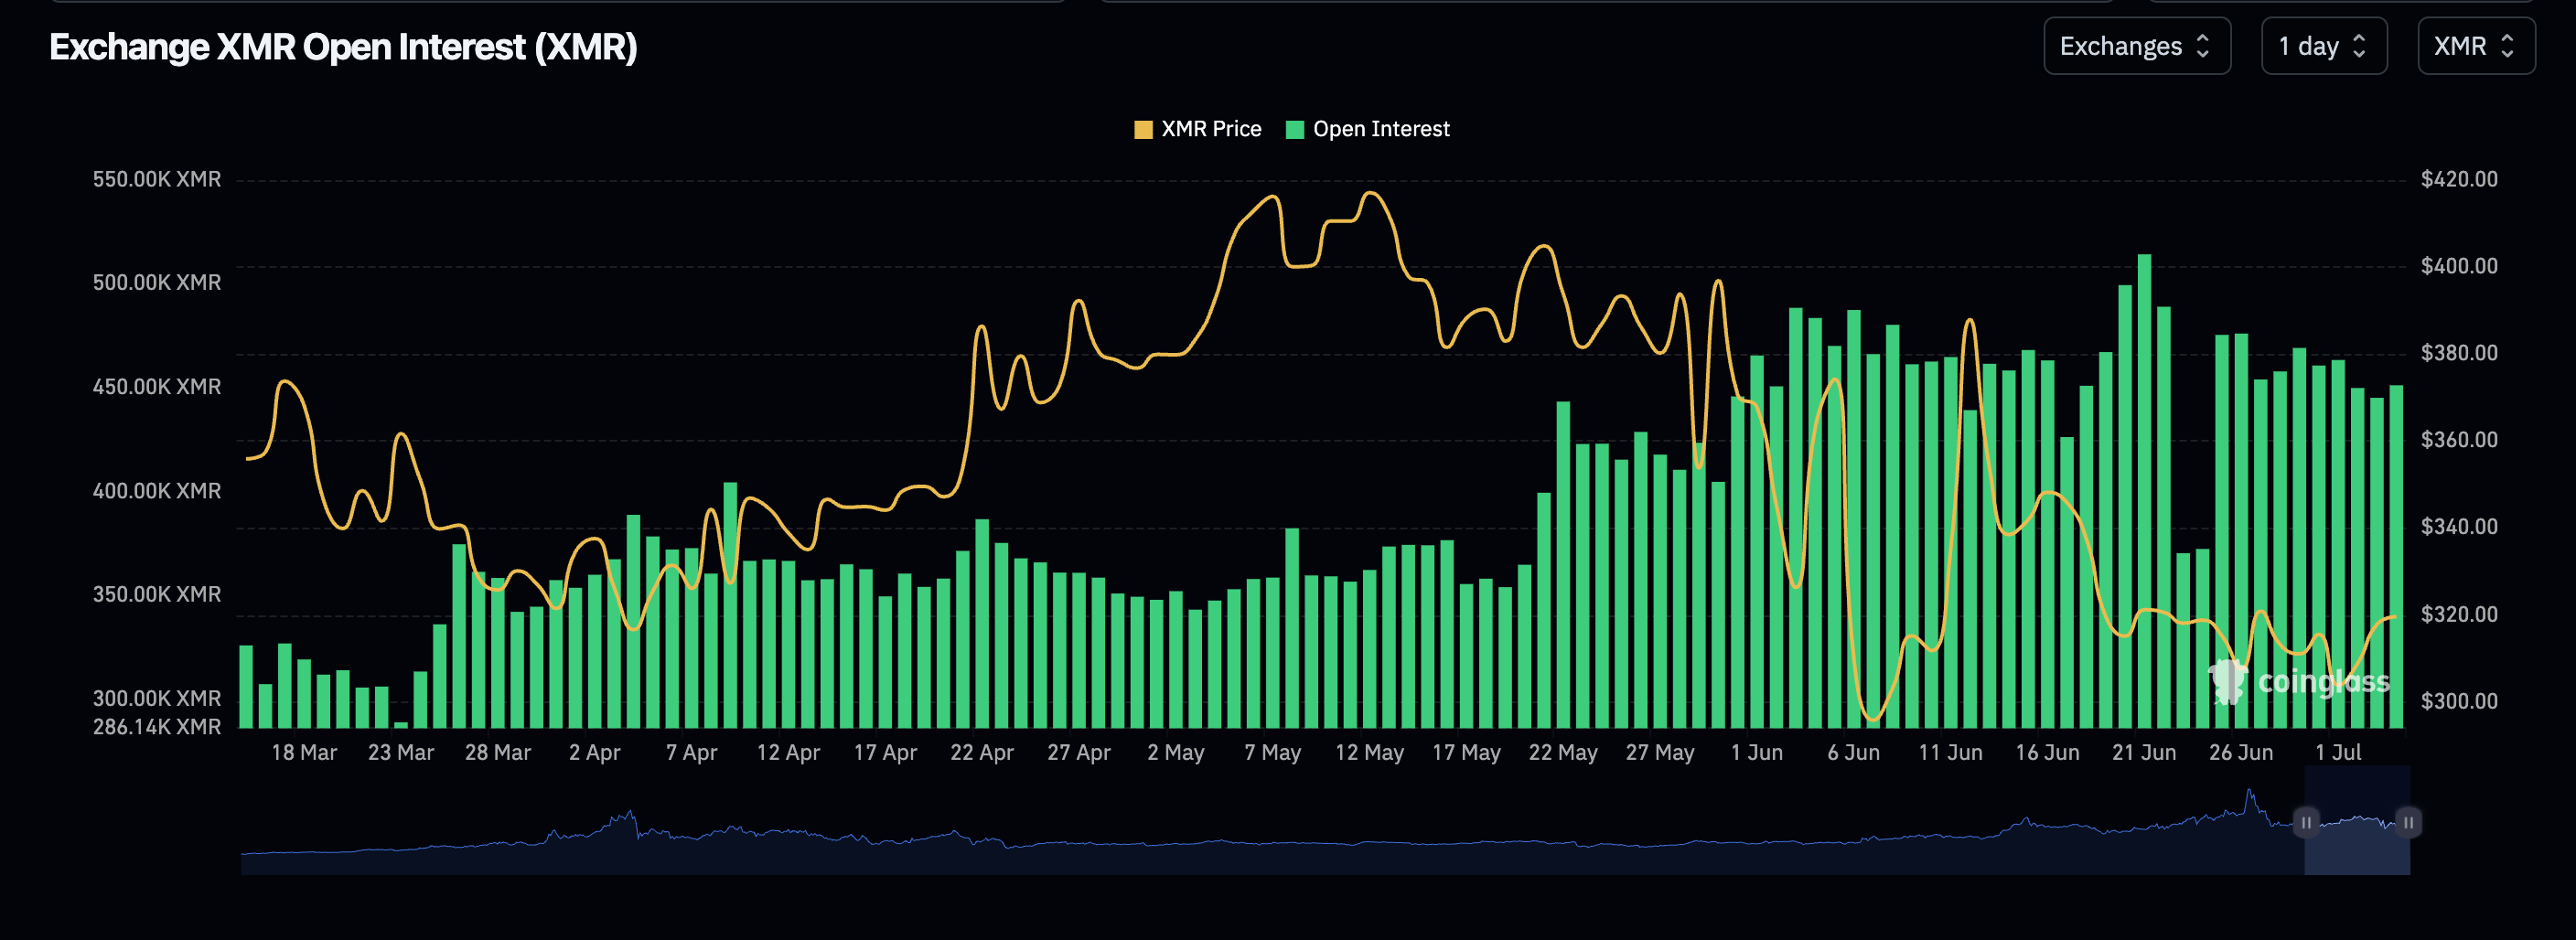
Monero reflects similar suppressed retail demand to ZEC, with futures OI standing at 452,000 XMR on Friday, up only marginally from 445,000 XMR. Despite the minor increase, CoinGlass data shows a steady decline from June’s peak of 514,000 XMR.
Demand for Monero derivatives remains significantly low at 28 million XMR, which marks a noticeable drop from nearly 32 million XMR on June 12. If retail remains on the sidelines and demand fails to improve, the ongoing rebound may be temporary and possibly give way to a reversal if investors sense exhaustion and book early profits.
Price analysis: Zcash builds recovery momentum
Monero trades above $460 while maintaining a bullish near-term bias as it holds firmly above the 200 EMA at $446 and the Bollinger Bands’ middle line near $421.
Momentum remains constructive, with the Relative Strength Index (RSI) hovering just below overbought territory around 68 on the 4-hour chart and the Moving Average Convergence Divergence (MACD) indicator staying in positive territory, hinting that upside pressure is still intact.
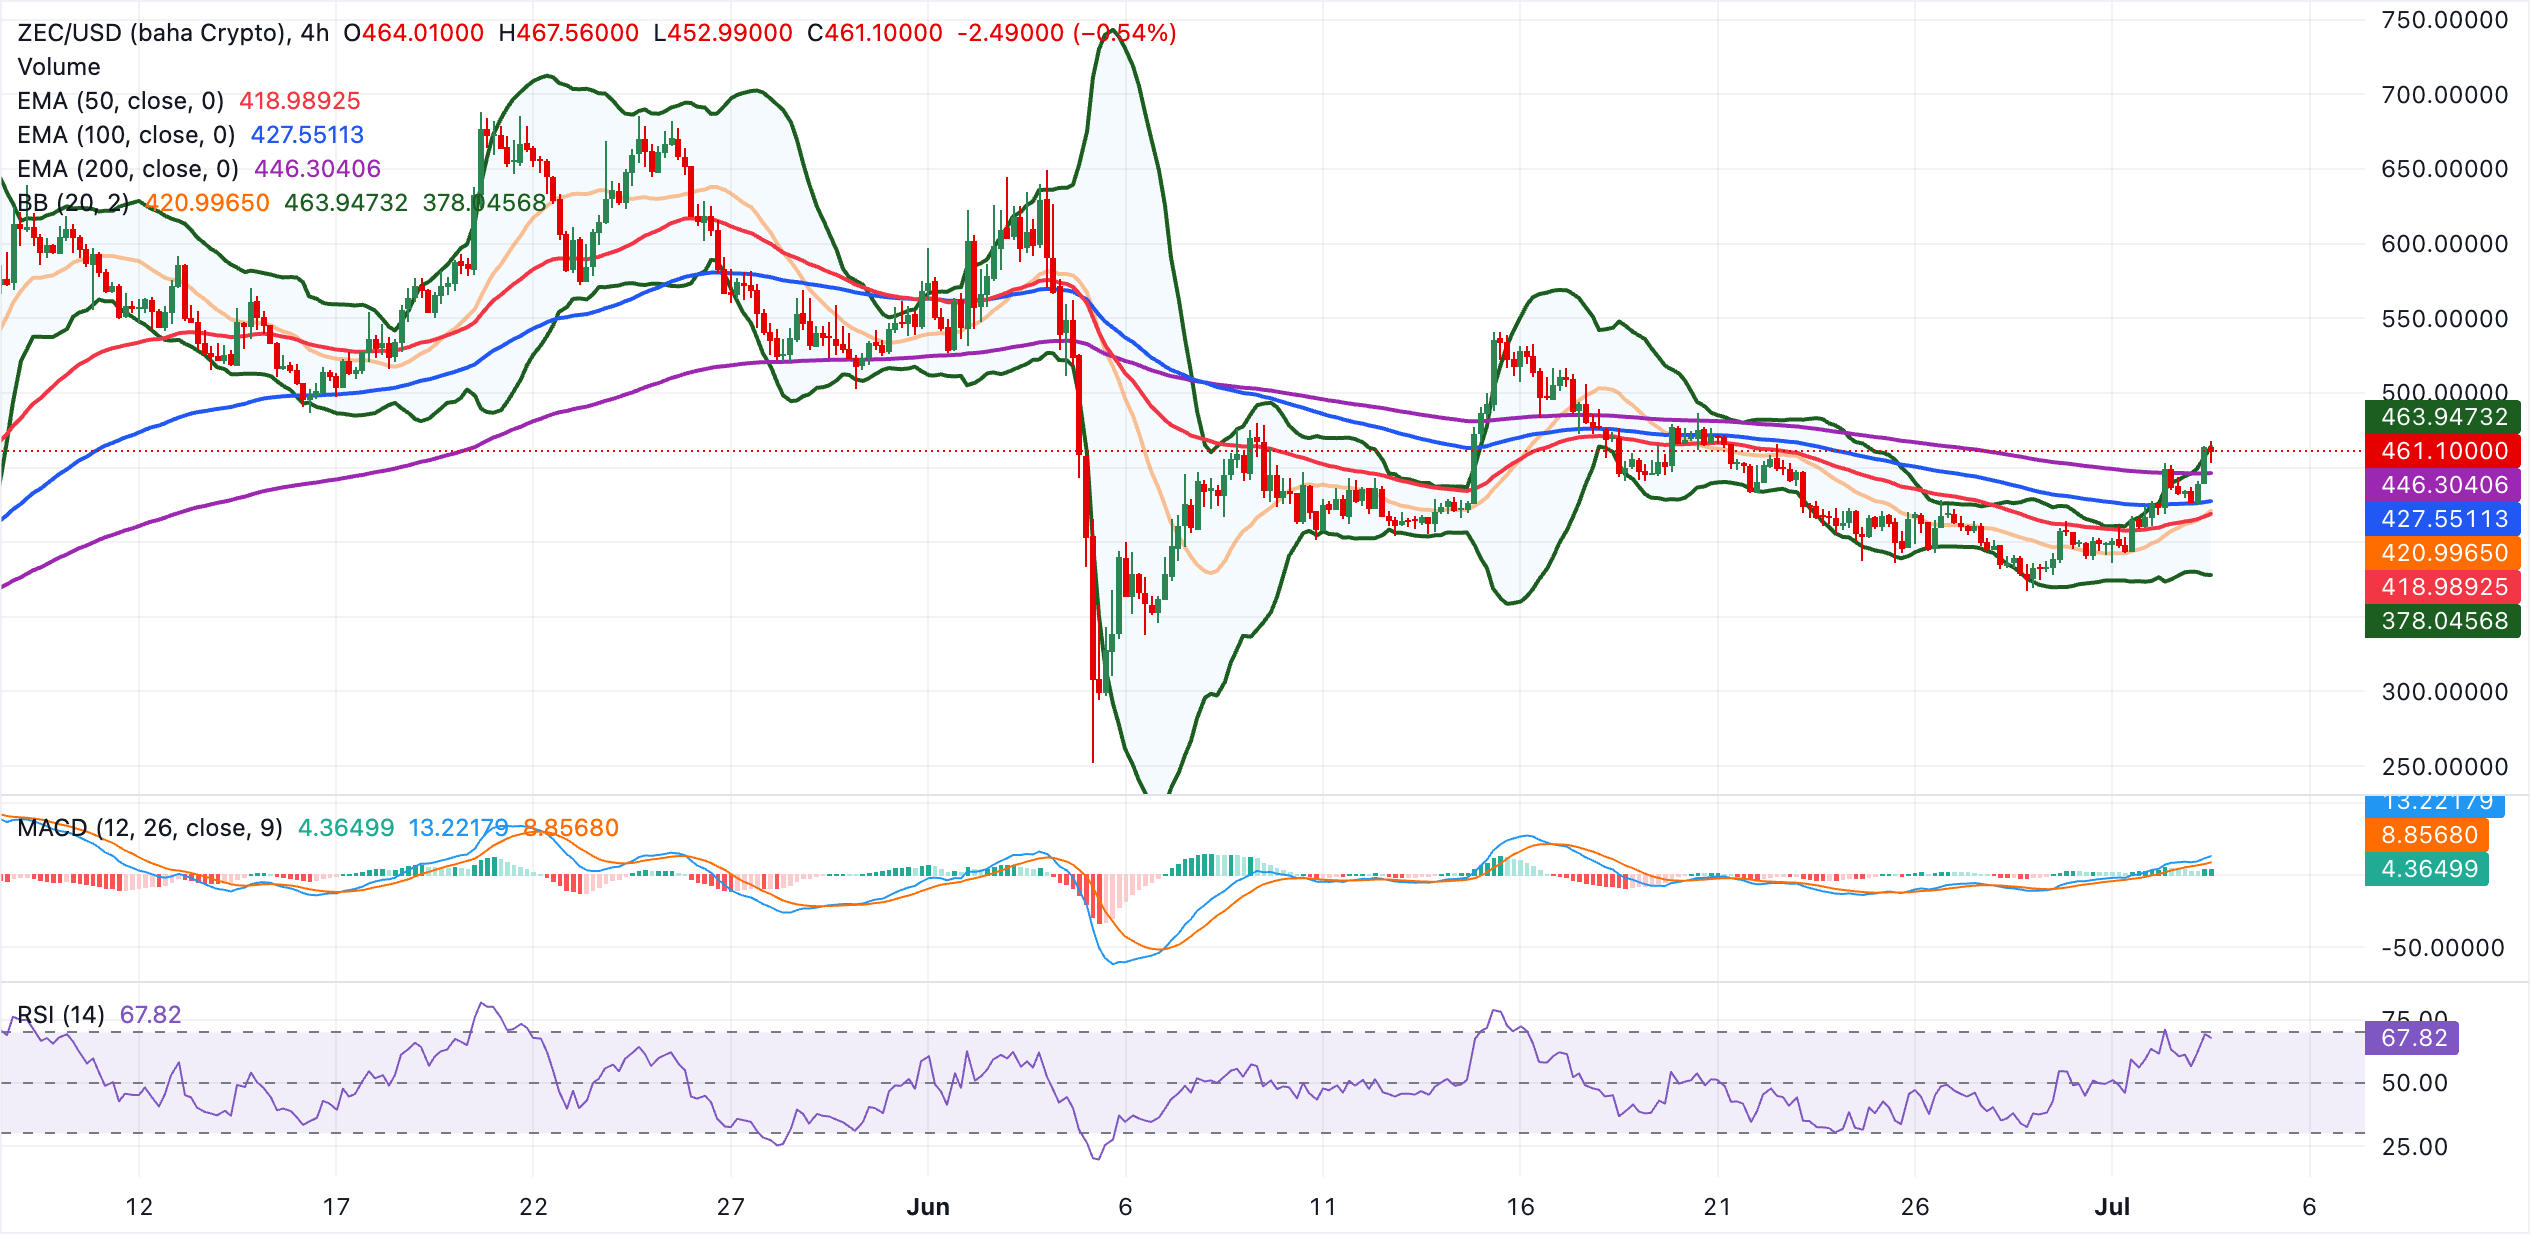
On the topside, immediate resistance aligns with the Bollinger Bands’ upper layer at $464. A sustained break above this level would open the door to further gains toward the $500 mark. On the flip side, initial support lies at the 200 EMA around $446, ahead of the cluster formed by the 100 and 50 EMAs at $428 and $419, respectively. A deeper setback toward the Bollinger Bands’ middle line at $421 would still keep the broader bullish structure intact as long as that zone holds.
Monero holds key support amid limited upside
Monero trades around $322, maintaining a constructive near-term bias as it holds above the 50 and 100 EMAs at roughly $314 and $319, while still trading below the 200 EMA at about $330, which caps the recovery.
The RSI hovers in bullish territory near 66 on the 4-hour chart, suggesting firm upside momentum, and the MACD remains positive with an expanding histogram, reinforcing the notion of persistent buying pressure despite the overhead trendline resistance.
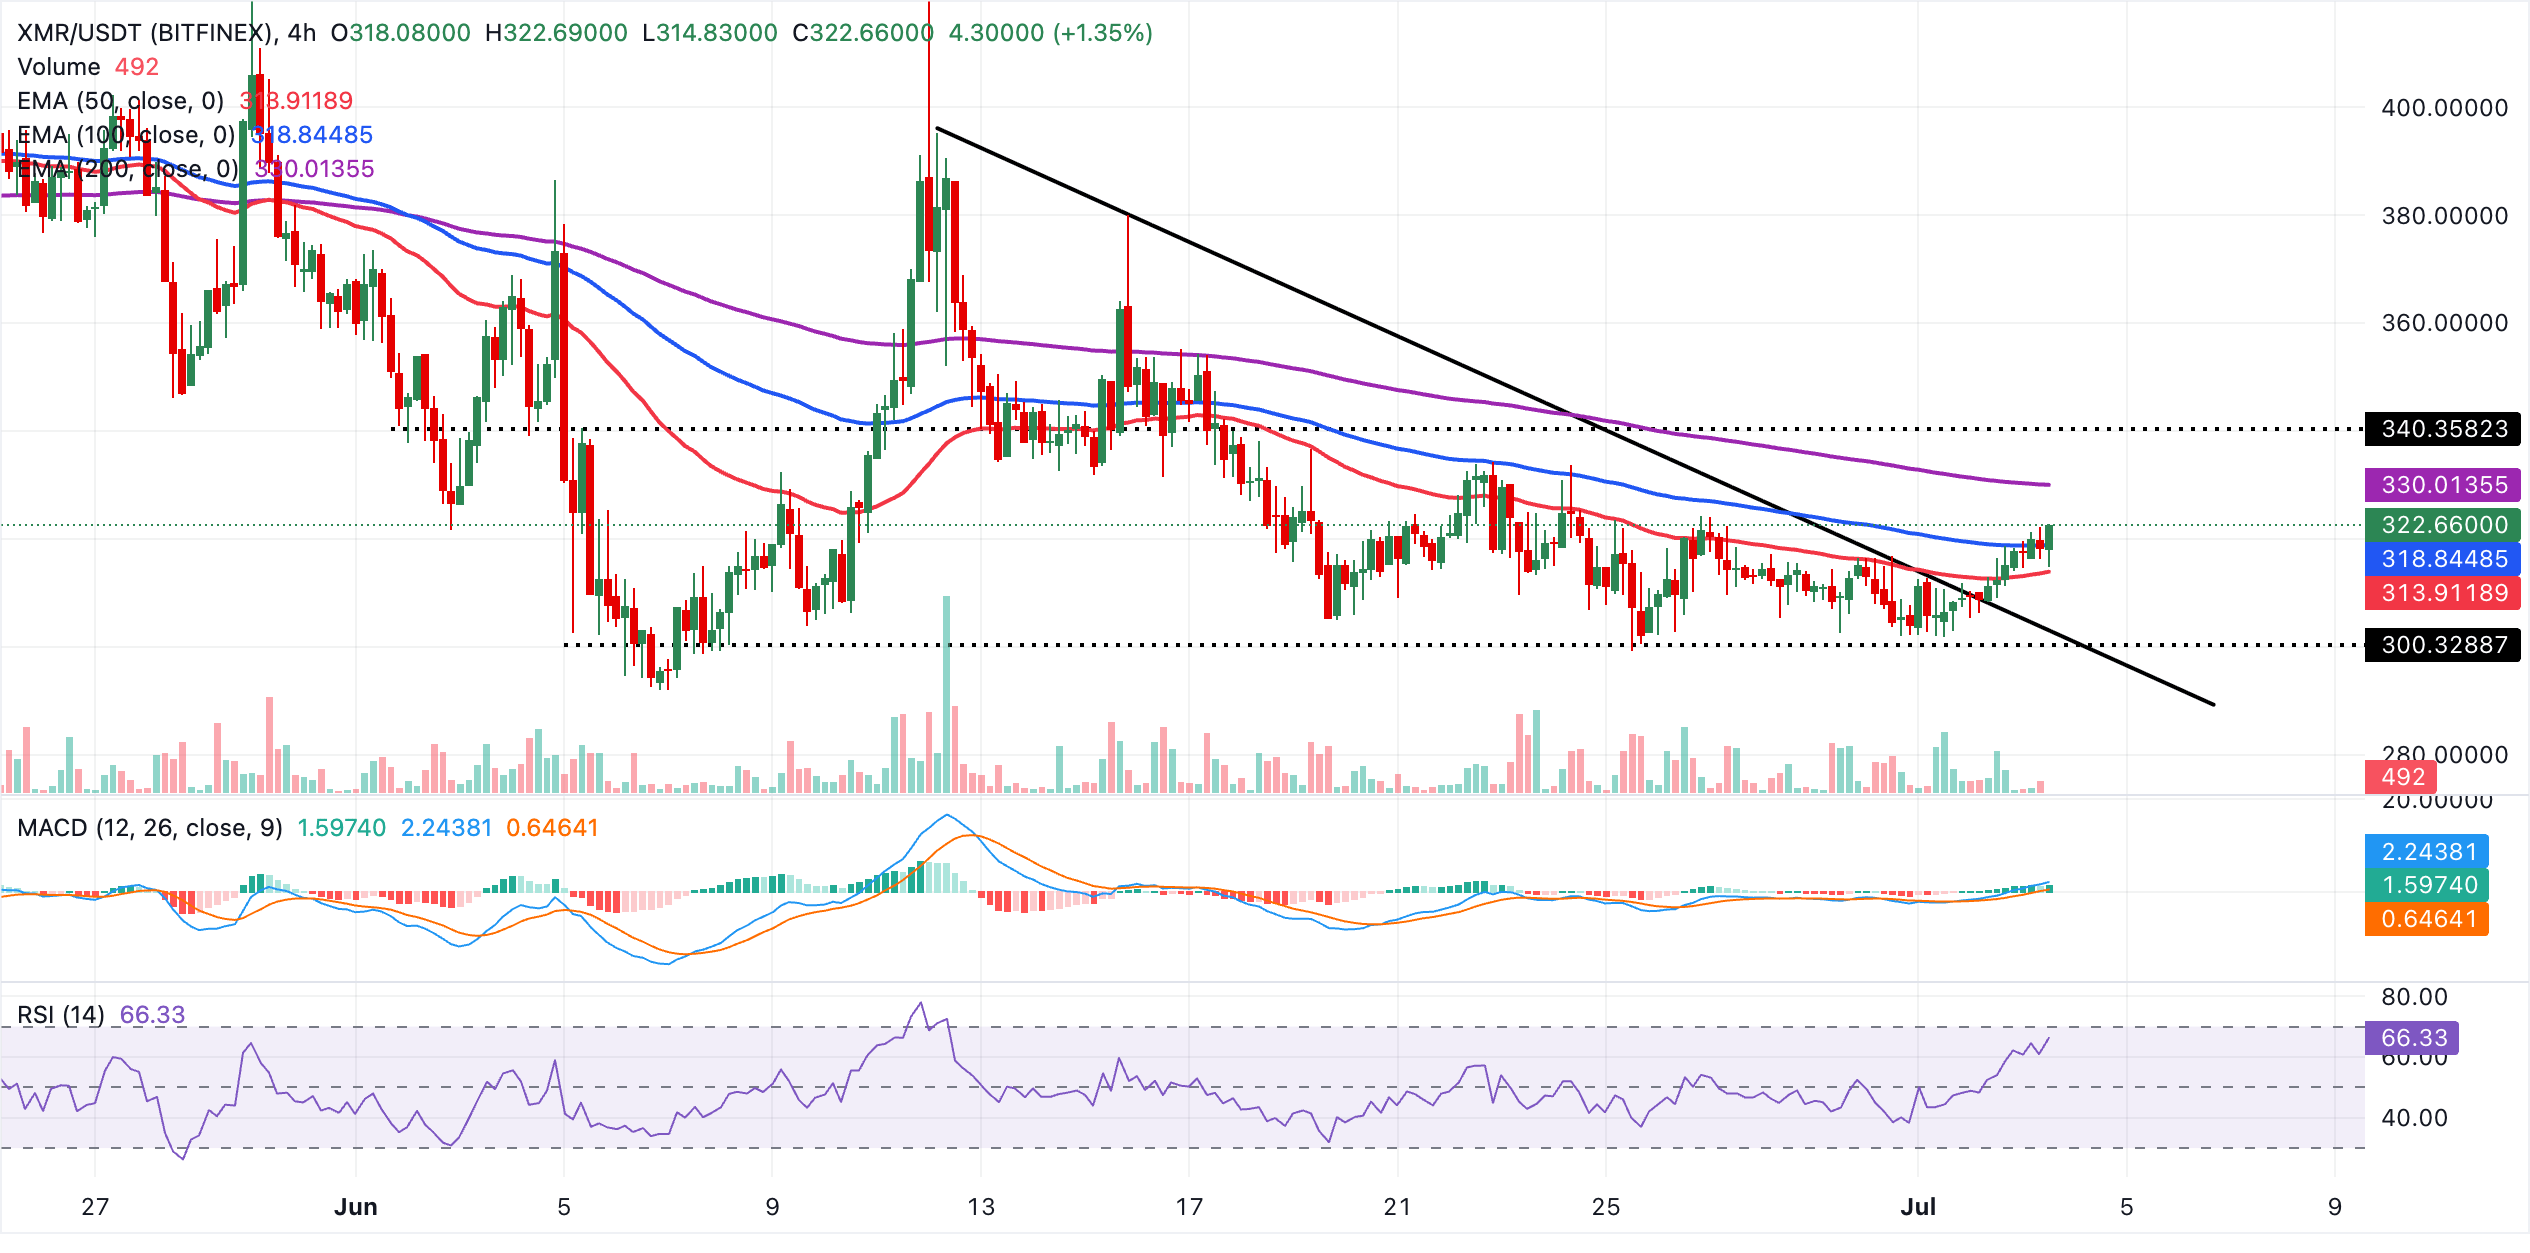
Initial resistance lies at the 200 EMA around $330, ahead of the horizontal supply range at $340, should buyers extend the advance. Looking down, initial support emerges at the 100 EMA near $319, followed by the 50 EMA around $314, while the former trendline break region close to $303 acts as a deeper structural floor if a sharper pullback unfolds.
(The technical analysis of this story was written with the help of an AI tool.)
Nothing in this material constitutes investment advice, personal recommendation, investment research, an offer, or a solicitation to buy or sell any financial instrument. The content has been prepared without consideration of your individual investment objectives, financial situation, or needs, and should not be treated as such.
Past performance is not a reliable indicator of future performance and/or results. Forward-looking scenarios or forecasts are not a guarantee of future performance. Actual results may differ materially from those anticipated.
Mitrade makes no representation or warranty as to the accuracy or completeness of the information provided and accepts no liability for any loss arising from reliance on such information.
Recommended Articles


