


CFDs are complex instruments and come with a high risk of losing money rapidly due to leverage. 80% of retail investor accounts lose money when trading CFDs with this provider. You should consider whether you understand how CFDs work and whether you can afford to take the high risk of losing your money.

Zcash Price Forecast: ZEC maintains bullish structure above key retracement support

Source Fxstreet
  • Zcash edges higher on Friday, holding above $500 after an 8% drop the previous day.
  • Derivatives data indicates mixed retail sentiment, with Open Interest contracts contracting, while a positive funding rate spike suggests bullish demand.
  • The technical outlook for Zcash is bullish, as the structural uptrend remains intact above a key retracement support level.

Zcash (ZEC) is up over 2% on Friday, recovering from an 8% decline the previous day. The privacy coin maintains its retail strength with a rising funding rate despite a minor contraction in ZEC futures Open Interest. Technically, ZEC retains a structural upward trend above its crucial moving averages with an upside toward $690.

Retail support holds amid minor pullback

CoinGlass data shows the ZEC futures Open Interest (OI) dropped over 5% in the last 24 hours to $1.10 billion, reflecting a contraction in active perpetual contracts, which aligns with Thursday’s pullback. However, the surge in funding rate to 0.0228%, from 0.0100% the previous day, reflects a buy-the-dip approach among traders. 
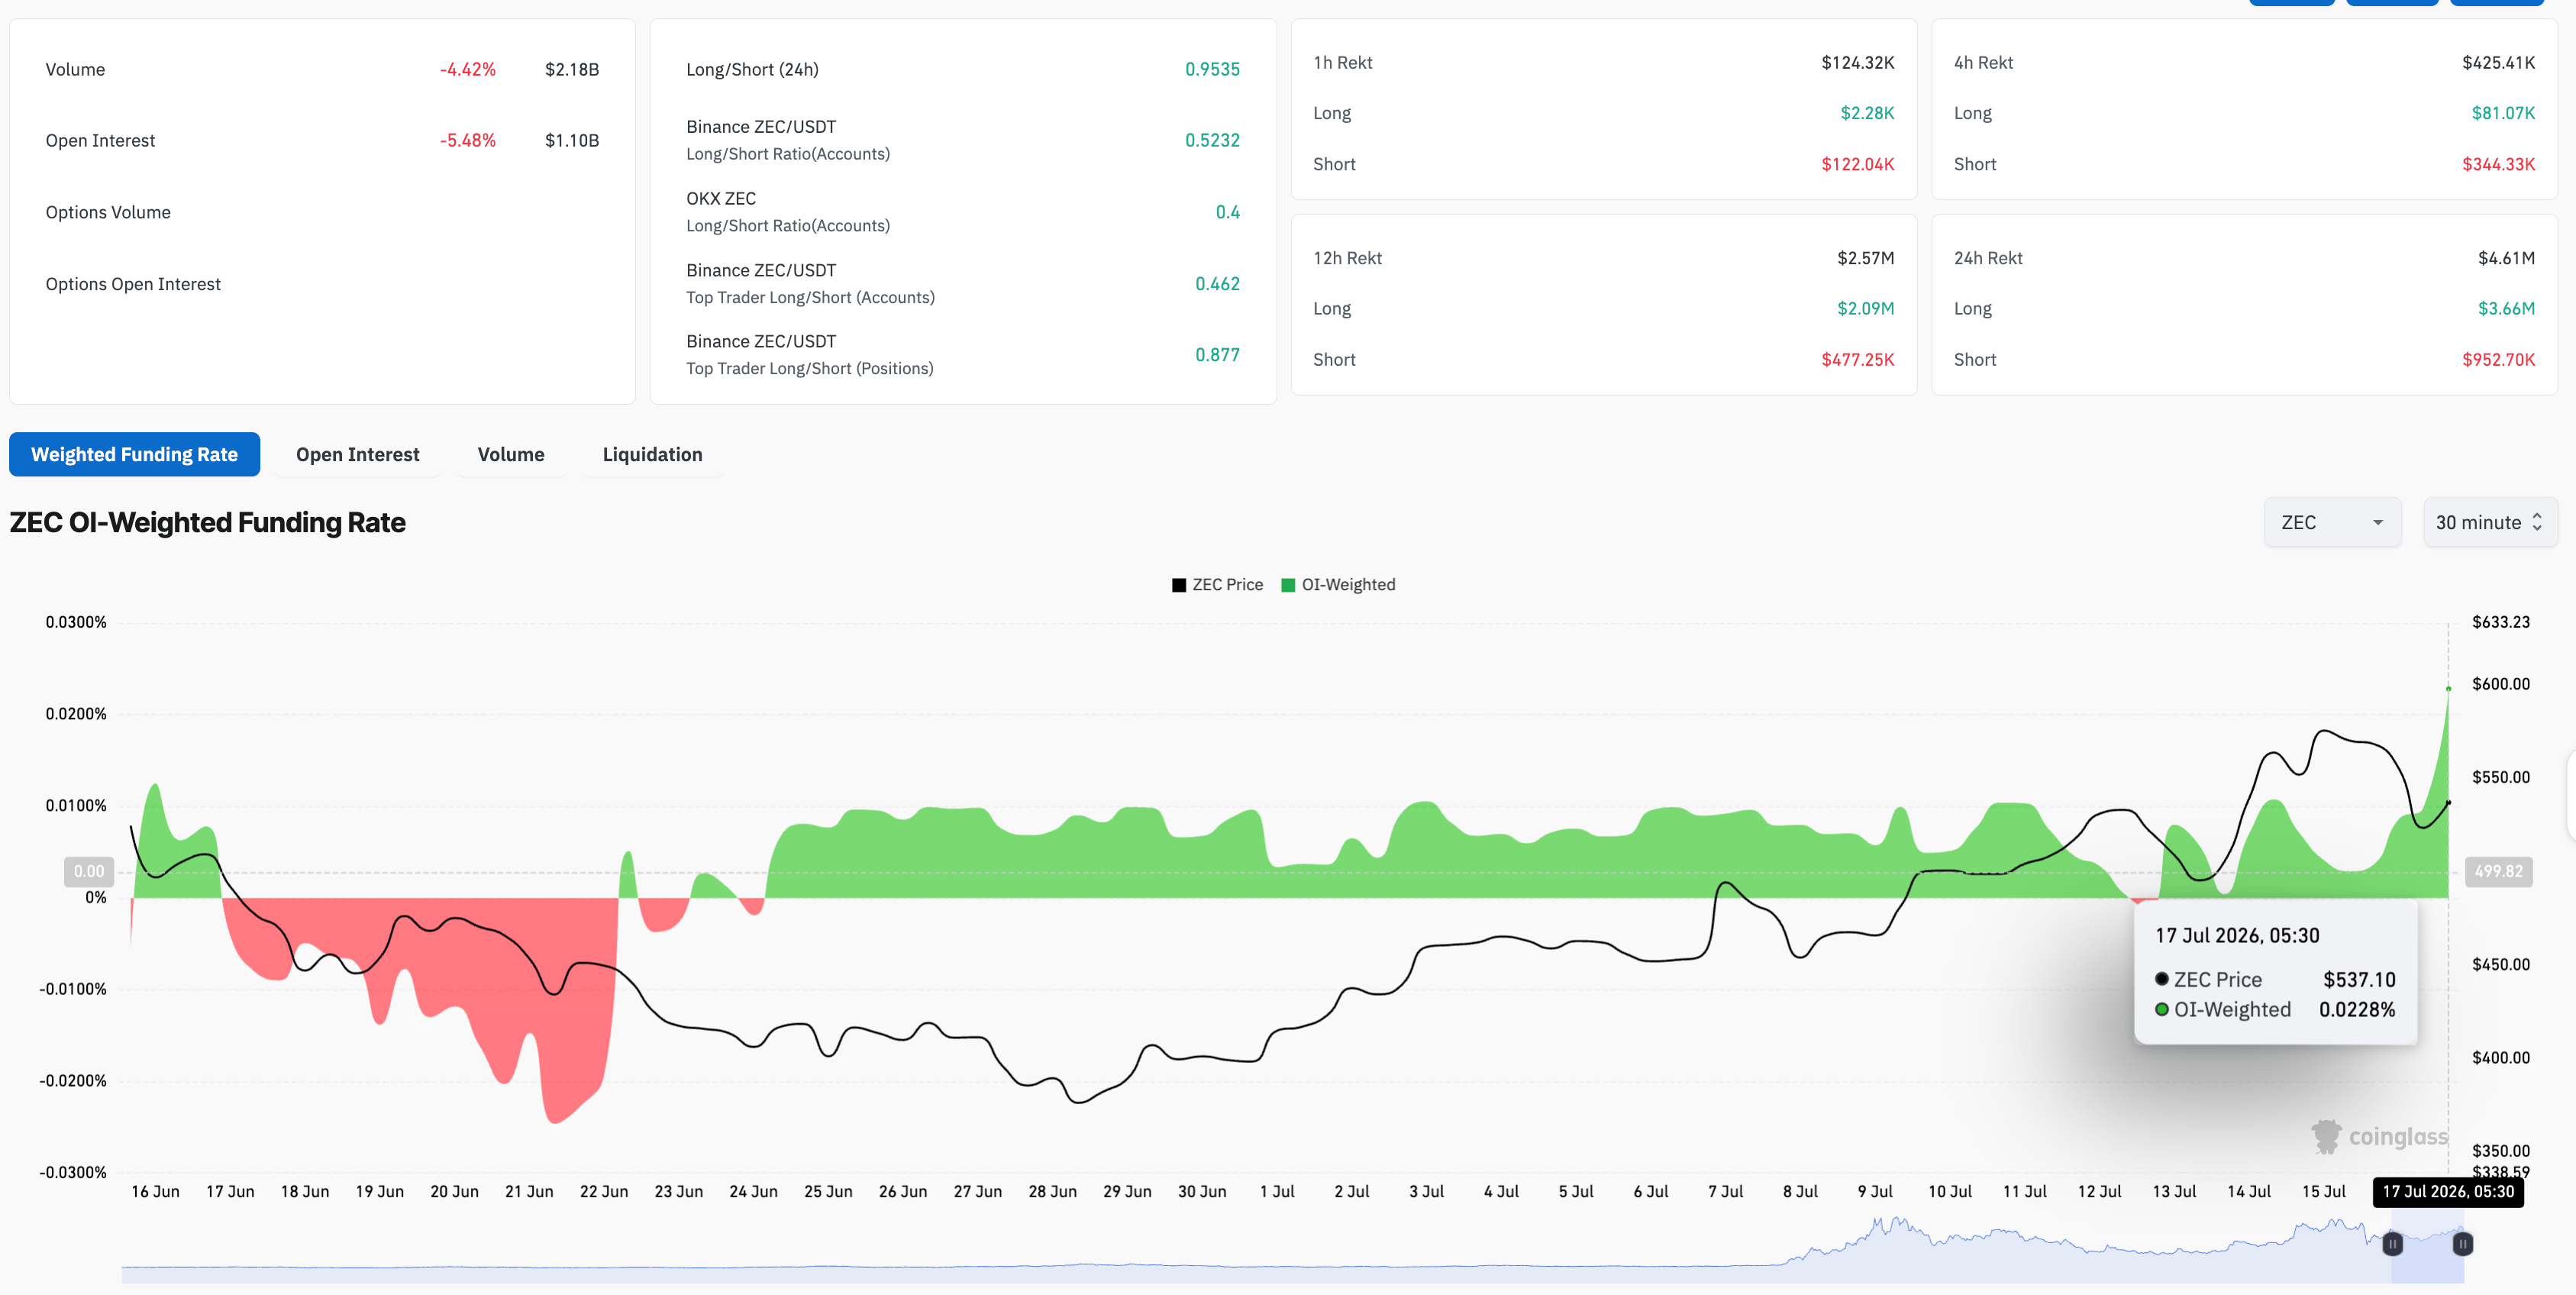
Zcash derivatives data. Source: CoinGlass

Will ZEC extend gains?

Zcash holds a bullish near-term bias above its 50-day Exponential Moving Average (EMA) at $476 and the 200-day EMA at $390. At the time of writing, ZEC is up 2% on Friday from its 78.6% Fibonacci retracement level at $520, measured over the $690 to $184 downswing, which reinforces a supported trend structure.

A steady upward trend could target the previous swing high of $690, and a breakout could extend the rally to the 127.2% Fibonacci extension at $987.

Momentum is constructive, with the Relative Strength Index (RSI) hovering near 58 with more upside before reaching the overbought levels. At the same time, the Moving Average Convergence Divergence (MACD) is rising into positive territory alongside its signal line, suggesting that buyers retain control.

Chart Analysis ZEC/USDT (Binance)
ZEC/USDT daily price chart.

On the downside, initial support is aligned with the 78.6% Fibonacci retracement at $520, where a deeper pullback could attract dip-buying interest near the 50-day EMA at $476.

(The technical analysis of this story was written with the help of an AI tool. Know more.)

Disclaimer: The content available on Mitrade Insights is provided for informational and marketing purposes only. It has not been prepared in accordance with legal requirements designed to promote the independence of investment research and is not subject to any prohibition on dealing ahead of the dissemination of investment research
Nothing in this material constitutes investment advice, personal recommendation, investment research, an offer, or a solicitation to buy or sell any financial instrument. The content has been prepared without consideration of your individual investment objectives, financial situation, or needs, and should not be treated as such.
Past performance is not a reliable indicator of future performance and/or results. Forward-looking scenarios or forecasts are not a guarantee of future performance. Actual results may differ materially from those anticipated.
Mitrade makes no representation or warranty as to the accuracy or completeness of the information provided and accepts no liability for any loss arising from reliance on such information.
placeholder
Bitcoin Open Interest Plunges: Derivatives 'Flush Out' May Signal Major BottomBitcoin open interest has seen its sharpest 30-day drop of the cycle, with 1.3 million BTC in futures wiped out as price falls over 30% from $126,000 — a deleveraging that analyst “Darkfost” says could mark a bottom if BTC can later reclaim the $90,000–$96,000 zone and revive the bull trend.
Author  Mitrade
Nov 24, 2025
Bitcoin open interest has seen its sharpest 30-day drop of the cycle, with 1.3 million BTC in futures wiped out as price falls over 30% from $126,000 — a deleveraging that analyst “Darkfost” says could mark a bottom if BTC can later reclaim the $90,000–$96,000 zone and revive the bull trend.
placeholder
Gold rises on firming Fed rate cut bets and weaker USD, positive risk tone might cap gainsGold (XAU/USD) attracts fresh buyers following the previous day's two-way price move and climbs back closer to the $4,150 level during the Asian session on Wednesday.
Author  FXStreet
Nov 26, 2025
Gold (XAU/USD) attracts fresh buyers following the previous day's two-way price move and climbs back closer to the $4,150 level during the Asian session on Wednesday.
placeholder
Financial Markets 2026: Volatility Catalysts in Gold, Silver, Oil, and Blue-Chip Stocks—A CFD Trader's OutlookThe financial world is perpetually in motion, but the landscape for 2026 seems to be shaping up to be particularly dynamic. For CFD traders navigating global markets, this heightened volatility could present a distinctive set of challenges and opportunities.
Author  Rachel Weiss
May 18, Mon
The financial world is perpetually in motion, but the landscape for 2026 seems to be shaping up to be particularly dynamic. For CFD traders navigating global markets, this heightened volatility could present a distinctive set of challenges and opportunities.
placeholder
HYPE gains, XRP extends losses amid Ripple Prime-Hyperliquid integrationRipple Prime, the institutional prime brokerage platform of Ripple, has integrated Hyperliquid (HYPE) in an effort to expand into the decentralized finance landscape.
Author  FXStreet
Feb 05, Thu
Ripple Prime, the institutional prime brokerage platform of Ripple, has integrated Hyperliquid (HYPE) in an effort to expand into the decentralized finance landscape.
placeholder
The Trumponomics Ebook: Oil Price Volatility in the Iran War Understand how the Strait of Hormuz shock moved markets, and what CFD traders watched next.
Author  Rachel Weiss
May 25, Mon
Understand how the Strait of Hormuz shock moved markets, and what CFD traders watched next.
goTop
quote