



Binance Coin Price Prediction: Can BNB Reach $10,000 by 2030?
How Has Binance Coin's Price Performed Over the Past Five Years?
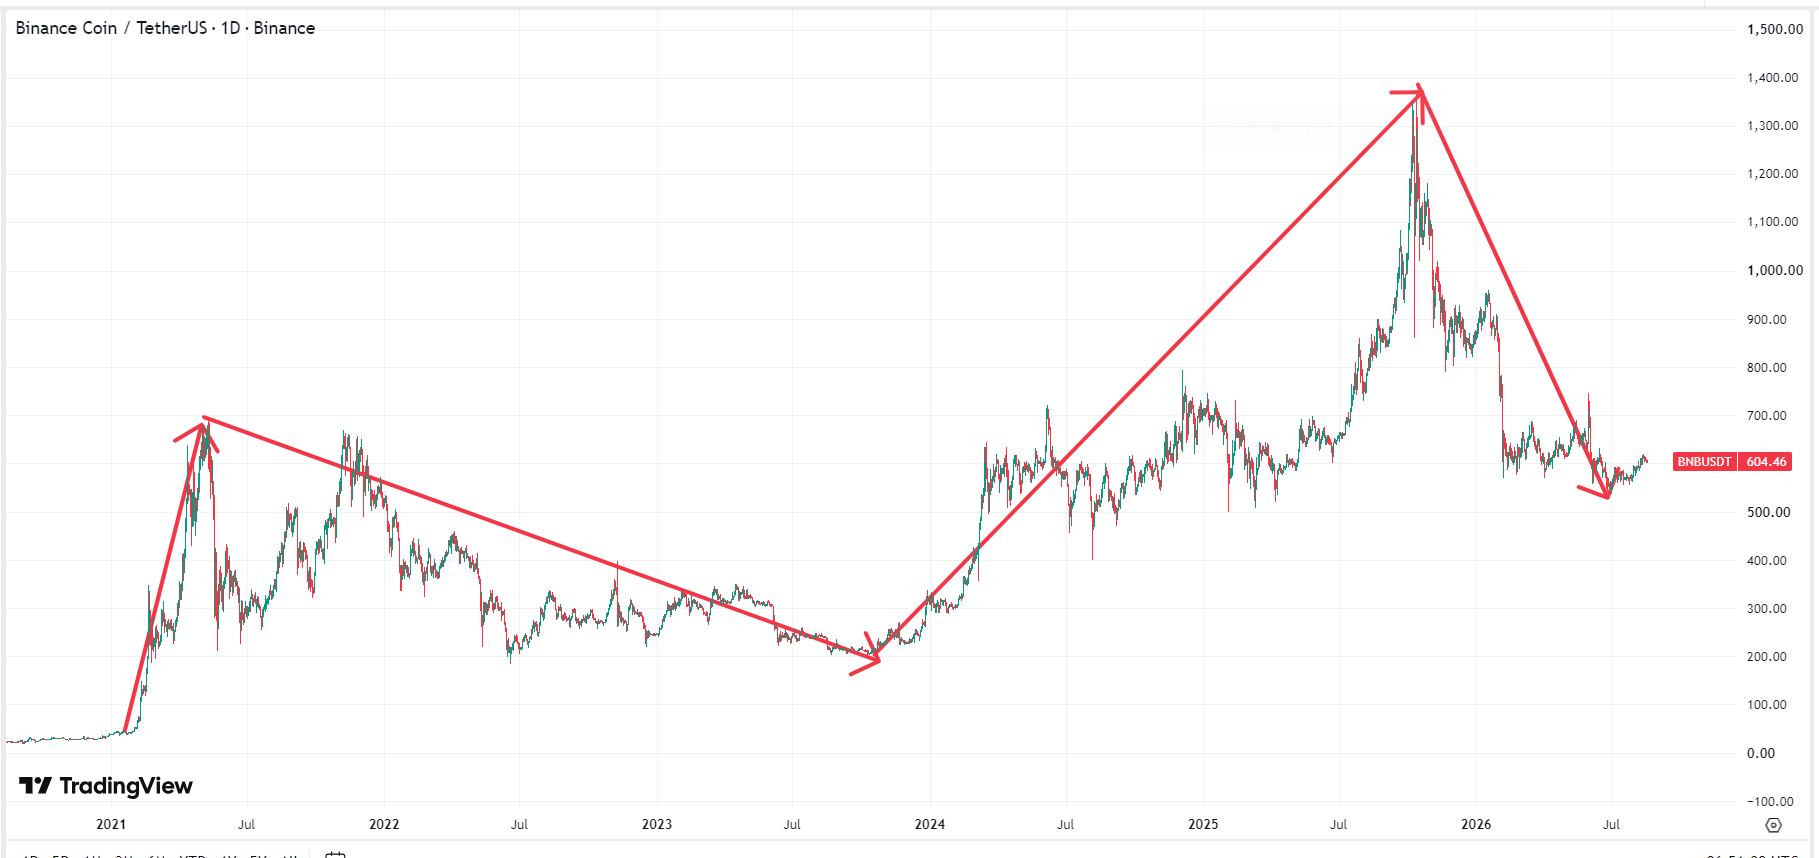
TradingKey - From 2021 to 2026, Binance Coin (BNB) experienced two major market cycles over the past five years. Its trend displayed significant high volatility and a step-like rising/falling curve, which overall can be divided into the following four key development stages: rally, decline, second rally, and second decline.
 BNB price chart, Source: TradingView
In early 2021, the price of BNB was still hovering around $40, before continuing to rise and surging to an all-time high of $690 five months later, representing a gain of over 16 times. Subsequently, the price of BNB fell rapidly, plummeting to around $200 within half a month, resulting in a drawdown of over 70%. At the end of the year, BNB surged a second time to above $600, but failed to break its previous high, subsequently entering a three-year bear market that saw it drop to a low around $180.
After entering 2024, the price of BNB completed a double bottom, followed by a continuous rebound and strengthening. In mid-year, it successfully broke through its 2021 peak and surged above $700 by year-end. In October 2025, the price of BNB broke through the $1,000 mark and rose to $1,369.99 in mid-month, setting a new all-time high. Entering 2026, BNB entered a downward channel once again, currently maintaining stable fluctuations within the $530–$630 range, with its market cap consolidated among the global top 4 crypto assets.
What Factors Affect Binance Coin Price Movements?
Looking at the past five years, BNB price movements have not been determined by a single factor, but rather influenced by multiple variables, primarily three: macroeconomics, the regulatory environment, and the exchange business ecosystem. Details are as follows:
Period | Market Cycle | Core Drivers / Market Background |
2021 | Bull Market Peak | Explosive growth in the BSC on-chain ecosystem (DeFi/GameFi) and the launch of the transaction fee burn mechanism. |
2022–2023 | Bear Market Winter | Macro interest rate hikes, the FTX collapse triggering a market liquidity crisis, and the U.S. SEC and CFTC suing Binance and its founder Changpeng Zhao (CZ). |
2024–2025 | New Bull Market | BTC halving rally, U.S. SEC approval of spot crypto ETFs, a surge in Launchpool locked value, and the deployment of the opBNB Layer 2 ecosystem. |
2026 | New Bear Market | Macroeconomic uncertainty triggers capital flight, while a broader crypto market correction leads to shrinking spot trading volumes, further dampening demand for the platform token BNB. |
Will Binance Coin Prices Continue to Fall This Year?
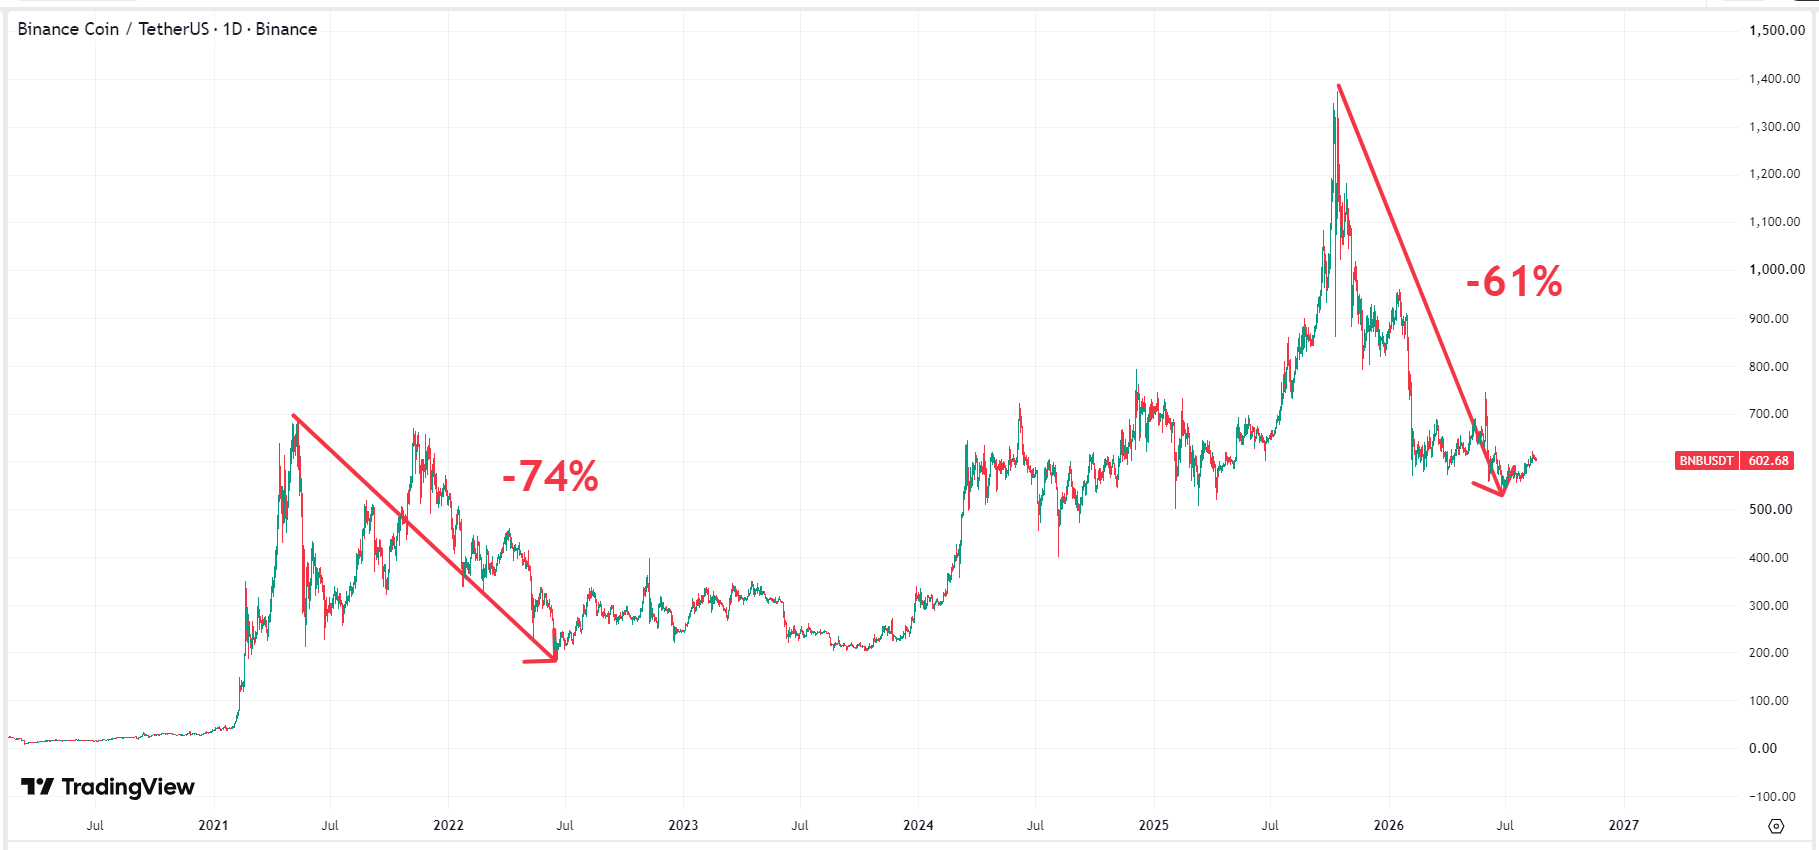
From both fundamental and technical perspectives, overall cryptocurrency volatility risks remain in the short term, and the possibility of another volatile decline alongside the broader market or even hitting new lows cannot be ruled out. Meanwhile, BNB prices are also under pressure and could fall to $350.
In 2026, institutional capital preferences are influenced by the global macroeconomic interest rate environment and U.S. inflation data (CPI/PPI). Some institutional funds have chosen to wait on the sidelines while holding assets as they await clear macroeconomic signals, and there have even been net outflows from spot ETFs, weighing on overall crypto market valuations. In addition, Binance's shift in focus from Launchpool projects toward traditional financial derivatives and tokenized assets has not only failed to drive BNB buying interest, but has also reduced investors' willingness to buy and lock up BNB long-term to receive airdrops.
Data shows that BNB's maximum drawdown reached 74% in the previous bear market, whereas the pullback in the current cycle so far is only 61%. If history repeats itself, BNB will need to fall below $350 to squeeze out the bubble. Furthermore, it took three years (2022–2024) for BNB to drop from its high to complete bottoming out, suggesting that BNB's weakness could persist until 2028.
 BNB price chart, Source: TradingView
Can BNB Break $10,000 in the Next Five Years?
Based on overall mathematical models and market capitalization ceilings, for the price of BNB to reach $10,000 over the next five years—calculated from its current price level of around $600—it would need to achieve a gain of more than 16 to 17 times. Achieving this is extremely difficult with a low probability, unless an above-expectation event occurs driven by the resonance of an extreme bull market and ultimate deflation, such as token burns accelerating to 100 million or Binance becoming a super financial gateway for global Web3 and TradFi.
Based on past bull markets, BNB's peak in the next bull market is more than double that of the previous cycle, implying that BNB's peak in 2030 would be around $3,000. However, some aggressive or above-expectation models suggest BNB could rise to $6,500–$8,000 over the next five years, though the prerequisites are quite demanding, including Bitcoin breaking through $250,000, total global crypto market capitalization surpassing $10 trillion, and BNB becoming a top global settlement token for RWA and Web3 ecosystems.
Conclusion
Over the past five years, BNB's price has experienced two cycles of boom and bust, with its trajectory driven primarily by three major factors: the macroeconomy, the regulatory environment, and the exchange ecosystem. Looking ahead, BNB reaching $10,000 by 2030 faces extremely high difficulty and a low probability, mainly constrained by valuation and market cap ceilings; without the combined force of an extreme bull market and extreme deflation, the peak of the next bull market is expected to fall around $3,000.
Nothing in this material constitutes investment advice, personal recommendation, investment research, an offer, or a solicitation to buy or sell any financial instrument. The content has been prepared without consideration of your individual investment objectives, financial situation, or needs, and should not be treated as such.
Past performance is not a reliable indicator of future performance and/or results. Forward-looking scenarios or forecasts are not a guarantee of future performance. Actual results may differ materially from those anticipated.
Mitrade makes no representation or warranty as to the accuracy or completeness of the information provided and accepts no liability for any loss arising from reliance on such information.
Recommended Articles


