



The Dow Jones Industrial Average buys its own bond problem
- DJIA trades roughly 430 points higher, back above 53,200 near session highs.
- Flash composite PMI at 56, the strongest reading since April 2022.
- Thirty-year yield back above 5.25%, erasing the buyback rally inside a day.
The Dow Jones Industrial Average trades roughly 430 points higher at just above 53,200, taking back the larger part of a Thursday decline that ran close to 690 points. The session low printed in the 52,800 area inside the opening stretch, and the index has ground higher in almost every hour since, changing hands within a handful of points of the 53,250 area that marks the session high.
The catalyst was a preliminary August activity survey that beat hard on services and missed on manufacturing, and the equity market read the composite as an all-clear on growth. The bond market read the same page and sold the long end again, which is precisely the arrangement that produced this week's drawdown in the first place.
The print that removes the escape route
The preliminary August composite Purchasing Managers Index (PMI) printed 56 against a 54.5 prior, the strongest expansion on the series since April 2022. Services drove it at 56.8 against a 54 consensus, the sharpest reading in that sector since December 2024, while manufacturing missed at 53.2 against 53.9 and goods output ran at a 13-month low. Delivery times lengthened and backlogs built across both sectors.
An economy expanding at a 56 composite does not need the policy help this equity market has spent the summer demanding, and it gives a committee that has held five times in a row no reason to supply it. Every point of this week's decline was blamed on Treasury yields. Friday's rebound is bought with the one print that makes those yields harder to bring down.
The inflation side of the same release did nothing to soften that, with input costs still rising at a marked pace across both sectors. The supply constraint behind them is not a mystery. Brent Crude Oil printed just short of $94.00 this week, its highest since late July, with Hormuz transit running at two or three tankers a day, and July inflation in both the United Kingdom and the euro area came in at 2.9% with energy named as a contributor.
The bid that lasted a day
Wednesday's announcement that liquidity-support buybacks in longer-dated coupons would at least double, from 2 billion Dollars an operation to at least 4 billion, took nine basis points off the thirty-year and lifted equity futures. By Thursday the entire move was gone. The thirty-year has climbed back above 5.25% and added roughly three basis points more on Friday, with the ten-year above 4.70%.
The Treasury Secretary spent Thursday explaining that the ceiling was a floor, that yields do not reflect fundamentals, and that a fiscal consolidation plan is coming from the White House within days. Set against federal debt that crossed 40 trillion Dollars this week and a deficit tracking past 2 trillion Dollars for the fiscal year, roughly 14 billion Dollars of extra quarterly purchases is a rounding error with a press release attached.
Membership decides the week, again
Healthcare carries Friday's advance through Merck (MRK) and Johnson & Johnson (JNJ), which makes it the second advance in three sessions bought with the same catalyst. Moderna (MRNA) is 17% higher on further late-stage data from the personalized cancer program it develops with Merck, having delivered a far larger move on the first instalment on Wednesday.
The tape's actual leadership sits outside the index altogether. Robinhood (HOOD) is 12% higher and Coinbase (COIN) 9% as Bitcoin runs more than 20% higher on the week, and the average collects nothing from either because neither is a member. The largest member move of the week ran the other way, with Walmart (WMT) more than 9% lower on Thursday on sales growth at a six-year low.
Next week does the repricing
July Personal Consumption Expenditures (PCE) prices land Wednesday at 12:30 GMT, with core expected at 0.2% MoM against a 0.1% prior and 3.3% YoY unchanged, alongside preliminary second-quarter Gross Domestic Product (GDP) at 1.5% and July durable goods at 0.7%. Nvidia (NVDA) reports after Wednesday's bell, and unlike almost everything that moved this week it is a member.
The Jackson Hole symposium runs August 27-29, and Friday packs the rest of the week into a single minute. At 14:00 GMT the Fed chair delivers a first keynote in the role, the preliminary nonfarm payrolls benchmark revision lands, and final August Michigan sentiment prints with one-year inflation expectations running at 4.3% into it. A revision that subtracts materially from the payrolls base would reset the growth argument this session just paid for.
Dow Jones Industrial Average technicals
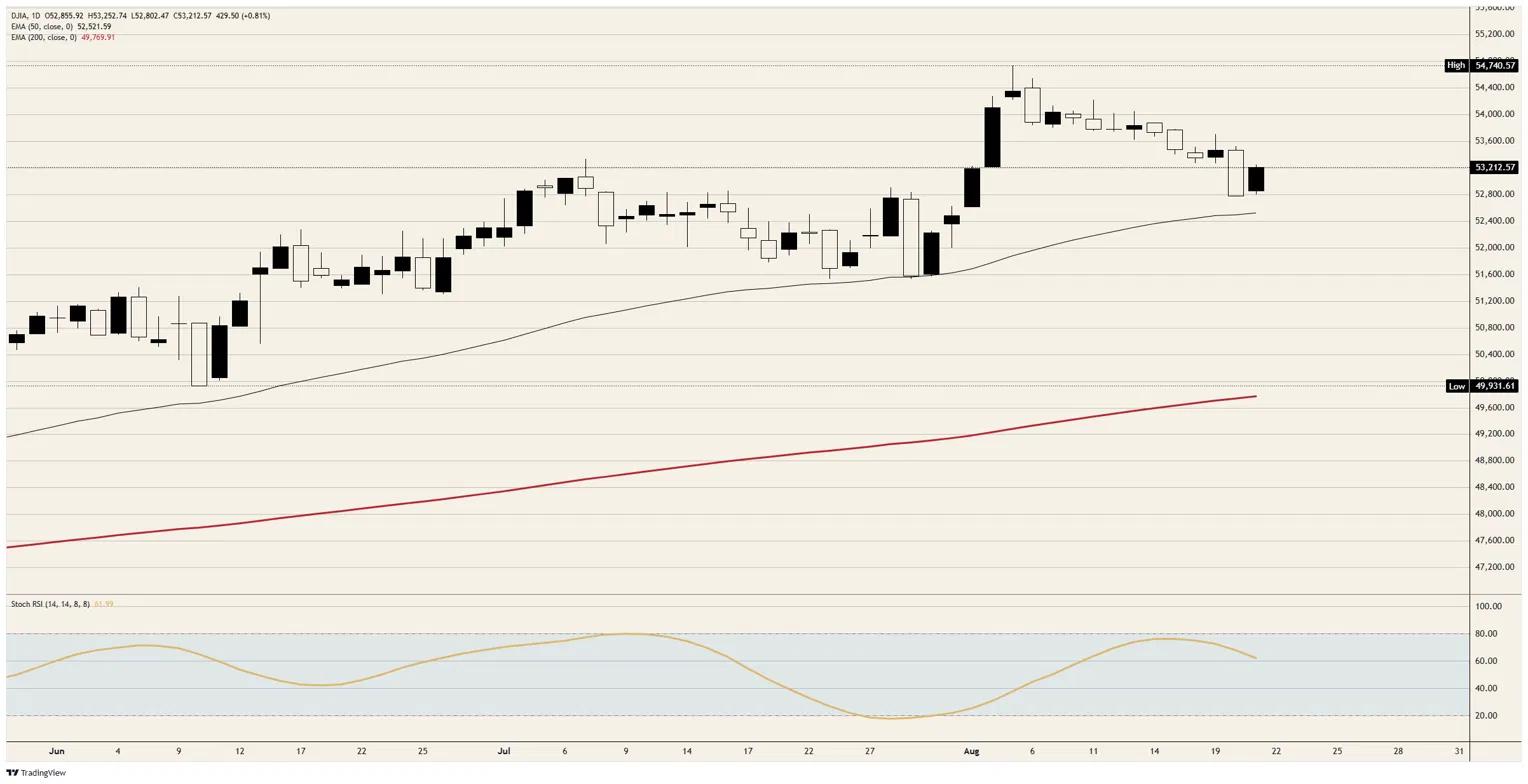
Resistance: The 53,250 area caps this session, and Thursday's breakdown point near 53,500 is the level that decides whether the rebound is more than a bounce. Above it sit the 53,800 shelf, the early-August ledge near 54,100 and the record just short of 54,750.
Support: The 52,800 area held the session low and Thursday's close sits just beneath it. Below that, 52,500 and the rising 50-day Exponential Moving Average (EMA) form one band, with the 200-day near 49,750 far below and out of play.
Bias: Bearish while 53,500 caps. Lower highs in each of the past three weeks leave this a rebound inside a downtrend, and the daily Stochastic Relative Strength Index (Stoch RSI) near 62 is mid-range rather than washed out, so the index is not lifting off an exhausted base. Objectives the 52,800 area then 52,500. Invalidation on a daily close above 53,750.
Dow Jones daily chart
Dow Jones FAQs
The Dow Jones Industrial Average, one of the oldest stock market indices in the world, is compiled of the 30 most traded stocks in the US. The index is price-weighted rather than weighted by capitalization. It is calculated by summing the prices of the constituent stocks and dividing them by a factor, currently 0.152. The index was founded by Charles Dow, who also founded the Wall Street Journal. In later years it has been criticized for not being broadly representative enough because it only tracks 30 conglomerates, unlike broader indices such as the S&P 500.
Many different factors drive the Dow Jones Industrial Average (DJIA). The aggregate performance of the component companies revealed in quarterly company earnings reports is the main one. US and global macroeconomic data also contributes as it impacts on investor sentiment. The level of interest rates, set by the Federal Reserve (Fed), also influences the DJIA as it affects the cost of credit, on which many corporations are heavily reliant. Therefore, inflation can be a major driver as well as other metrics which impact the Fed decisions.
Dow Theory is a method for identifying the primary trend of the stock market developed by Charles Dow. A key step is to compare the direction of the Dow Jones Industrial Average (DJIA) and the Dow Jones Transportation Average (DJTA) and only follow trends where both are moving in the same direction. Volume is a confirmatory criteria. The theory uses elements of peak and trough analysis. Dow’s theory posits three trend phases: accumulation, when smart money starts buying or selling; public participation, when the wider public joins in; and distribution, when the smart money exits.
There are a number of ways to trade the DJIA. One is to use ETFs which allow investors to trade the DJIA as a single security, rather than having to buy shares in all 30 constituent companies. A leading example is the SPDR Dow Jones Industrial Average ETF (DIA). DJIA futures contracts enable traders to speculate on the future value of the index and Options provide the right, but not the obligation, to buy or sell the index at a predetermined price in the future. Mutual funds enable investors to buy a share of a diversified portfolio of DJIA stocks thus providing exposure to the overall index.
Nothing in this material constitutes investment advice, personal recommendation, investment research, an offer, or a solicitation to buy or sell any financial instrument. The content has been prepared without consideration of your individual investment objectives, financial situation, or needs, and should not be treated as such.
Past performance is not a reliable indicator of future performance and/or results. Forward-looking scenarios or forecasts are not a guarantee of future performance. Actual results may differ materially from those anticipated.
Mitrade makes no representation or warranty as to the accuracy or completeness of the information provided and accepts no liability for any loss arising from reliance on such information.
Recommended Articles


