



Cardano Price Forecast: ADA risks steeper decline amid easing retail demand
- Cardano is down 2% so far on Thursday, risking a decline below the $0.20 mark.
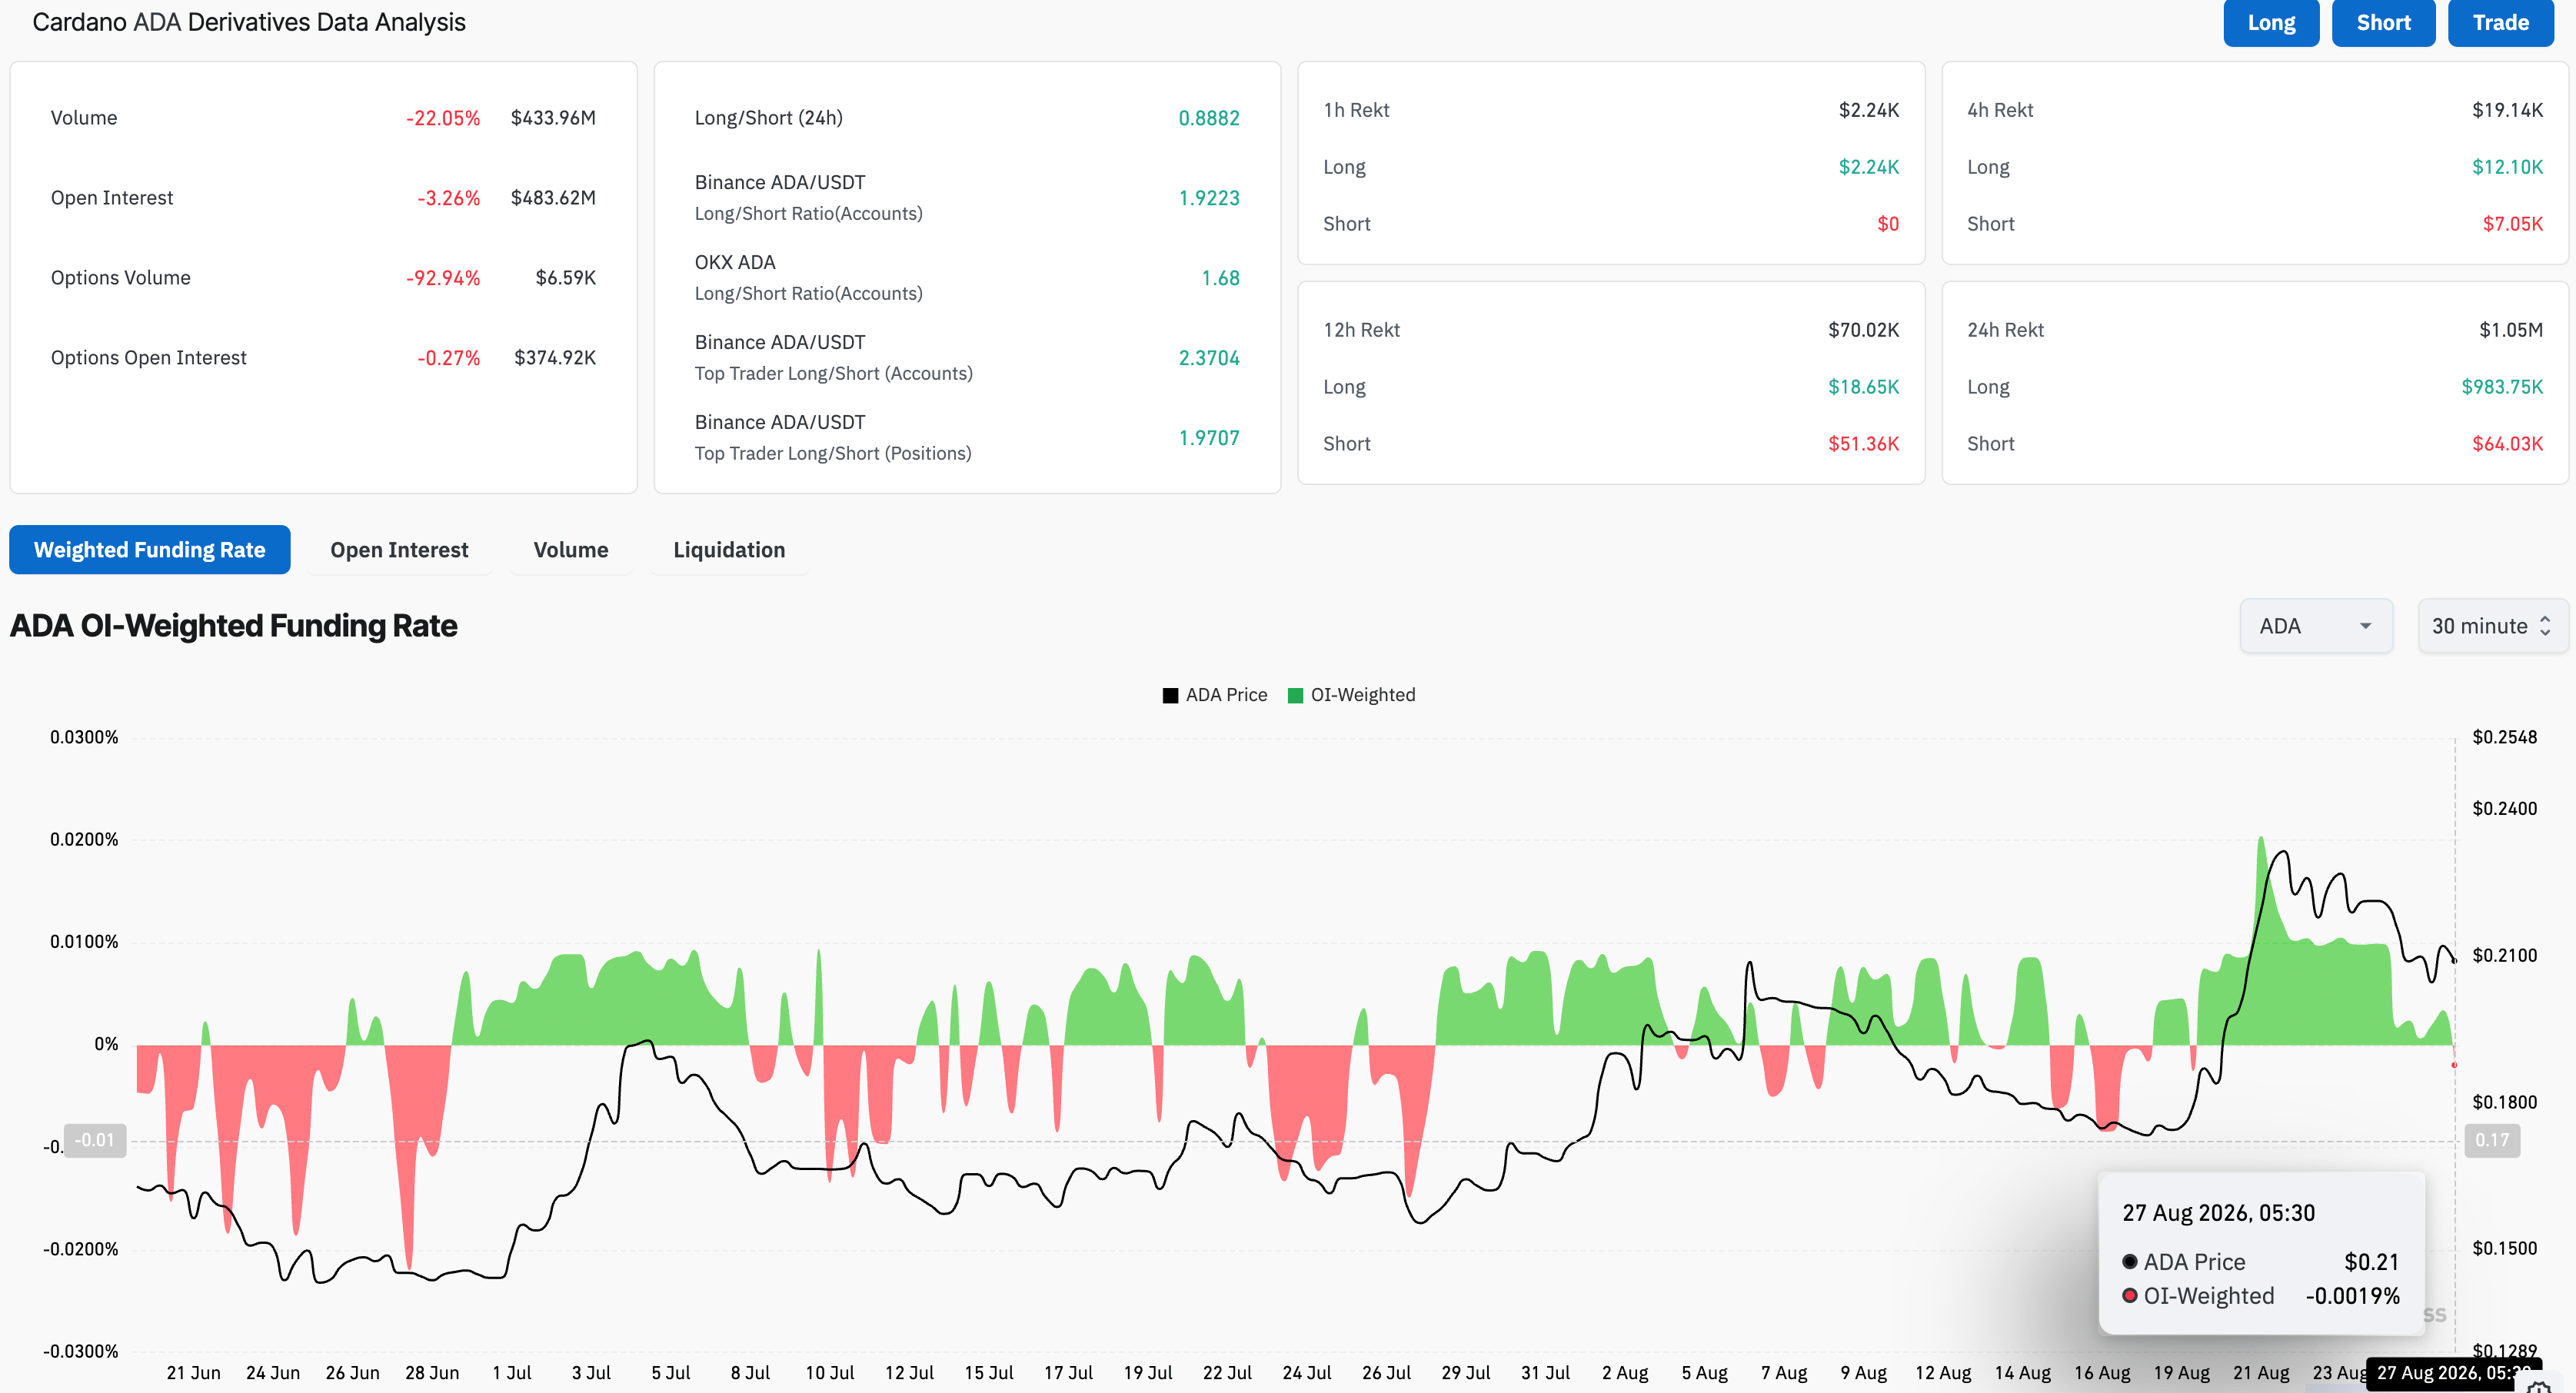
- ADA futures point to waning retail strength as Open Interest and funding rate decline.
- The technical outlook for ADA is bearish, with the 50-day EMA at $0.1899 as the immediate support level.
Cardano (ADA) is trading in the red on Thursday, with roughly 10% losses so far this week, suggesting capitulation after last week’s 30% rally. Waning retail demand in ADA futures amid declining Open Interest and funding rates suggests capitulation speculation. The technical outlook for ADA is bearish, with bears targeting the 50-day Exponential Moving Average (EMA) at $0.1899.
Retail demand weakens
Cardano futures witness a bearish shift in retail activity as the previous week’s rally struggles to hold above $0.20. CoinGlass data shows that ADA futures Open Interest (OI) is down 3% over the last 24 hours to $483.62 million, suggesting a reduction in the notional value of active contracts or a positional wipeout. Long liquidations of $983,750 in the same period, outpacing short liquidations of $64,030, reaffirm sell-side dominance and a bullish positional wipeout.
At the same time, the OI-weighted funding rate has flipped negative to -0.0019%, indicating a bearish bias among retail traders, willing to buy short positions at a premium.
Technical outlook: Cardano’s losing bullish momentum
Cardano's 30% rally last week was capped by the 200-day EMA at $0.2483 and an overhead trendline near $0.2333 on Saturday. At the time of writing, ADA shows a mild bearish near-term bias as it extends a pullback toward the 50-day Exponential Moving Average (EMA) at $0.1898.
Momentum reflects the shift away from a constructive tone, with the Relative Strength Index (RSI) sloping down to 57 from the overbought region, while the Moving Average Convergence Divergence (MACD) and signal line stall above zero as histograms contract, hinting that buyers are losing control.
Looking down, the 50-day EMA at $0.1898 emerges as the immediate support for ADA, guarding the downside to the ascending trendline near $0.1705.
On the topside, Cardano must surpass the 200-day EMA at $0.2483 as the next key resistance to sustain its recovery run. A confirmed breakout above $0.2483 could open the door for a more extended recovery toward the February 3 high at $0.3050.
(The technical analysis of this story was written with the help of an AI tool. Know more.)
Nothing in this material constitutes investment advice, personal recommendation, investment research, an offer, or a solicitation to buy or sell any financial instrument. The content has been prepared without consideration of your individual investment objectives, financial situation, or needs, and should not be treated as such.
Past performance is not a reliable indicator of future performance and/or results. Forward-looking scenarios or forecasts are not a guarantee of future performance. Actual results may differ materially from those anticipated.
Mitrade makes no representation or warranty as to the accuracy or completeness of the information provided and accepts no liability for any loss arising from reliance on such information.
Recommended Articles


