


CFDs are complex instruments and come with a high risk of losing money rapidly due to leverage. 80% of retail investor accounts lose money when trading CFDs with this provider. You should consider whether you understand how CFDs work and whether you can afford to take the high risk of losing your money.

Solana Price Forecast: Strong institutional confidence keeps SOL afloat above $100

Source Fxstreet
  • Solana hovers above $100 on Monday, testing the psychological support after a 3% drop the previous day.
  • SOL-focused ETFs recorded over $150 million in inflows last week, the second-highest since the inception week.
  • The technical outlook for Solana is mixed as the price tests key psychological support amid waning bullish momentum.

Solana (SOL) price is trading around $100 on Monday, testing the psychological support level after a 3% decline the previous day. SOL-focused Exchange Traded Funds (ETFs) recorded over $150 million in inflows last week, reflecting strong institutional demand. Solana risks capitulation as price tests the $100 threshold amid easing bullish momentum.

ETF inflows, double disinflation projects long-term growth

Solana is gaining institutional strength amid major governance updates. SOL-focused ETFs recorded $153.87 million in inflows last week, with nine consecutive days of inflows. Typically, strong ETF inflows project long-term growth, fueling demand from large-wallet and retail investors amid growing risk appetite.
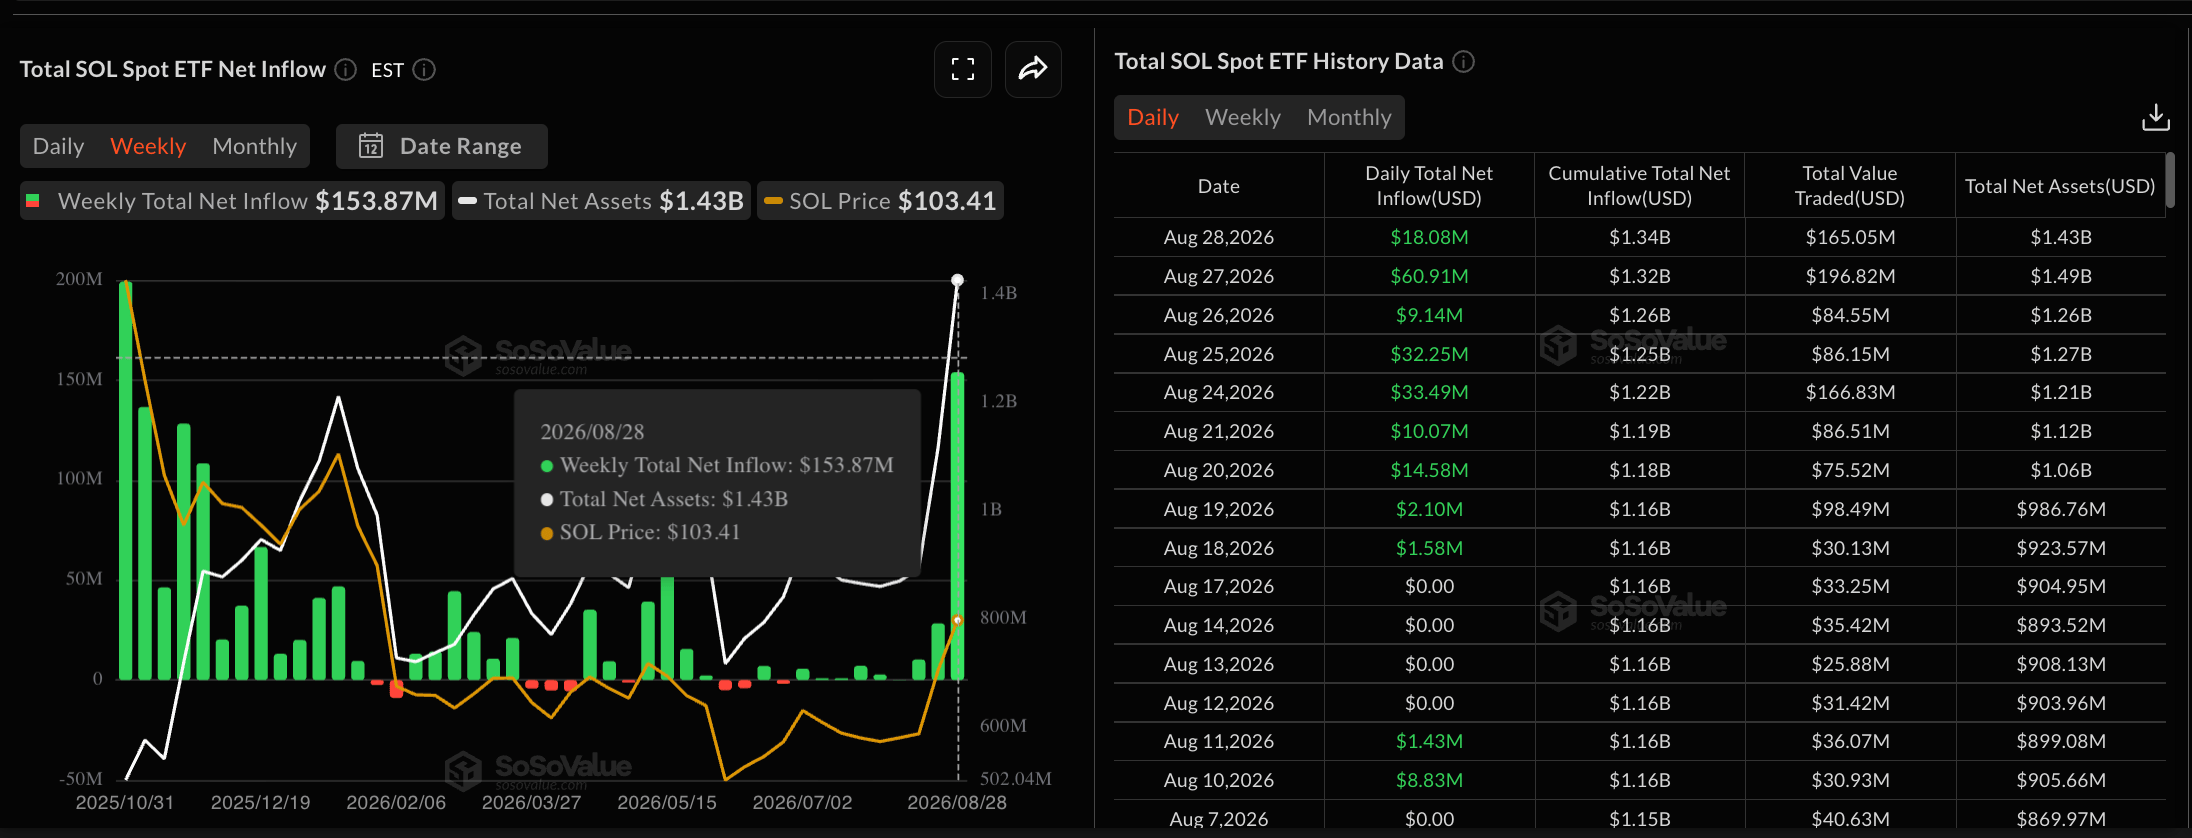
SOL ETFs data. Source: Sosovalue

On the network side, Solana validators voted to double the disinflation rate to 30% and establish a new governance framework. However, the proposal to introduce usage-based fees, which could have raised daily SOL burns to almost 9,000 tokens, failed. Overall, the governance votes favored better structuring and disinflation to promote long-term growth. 
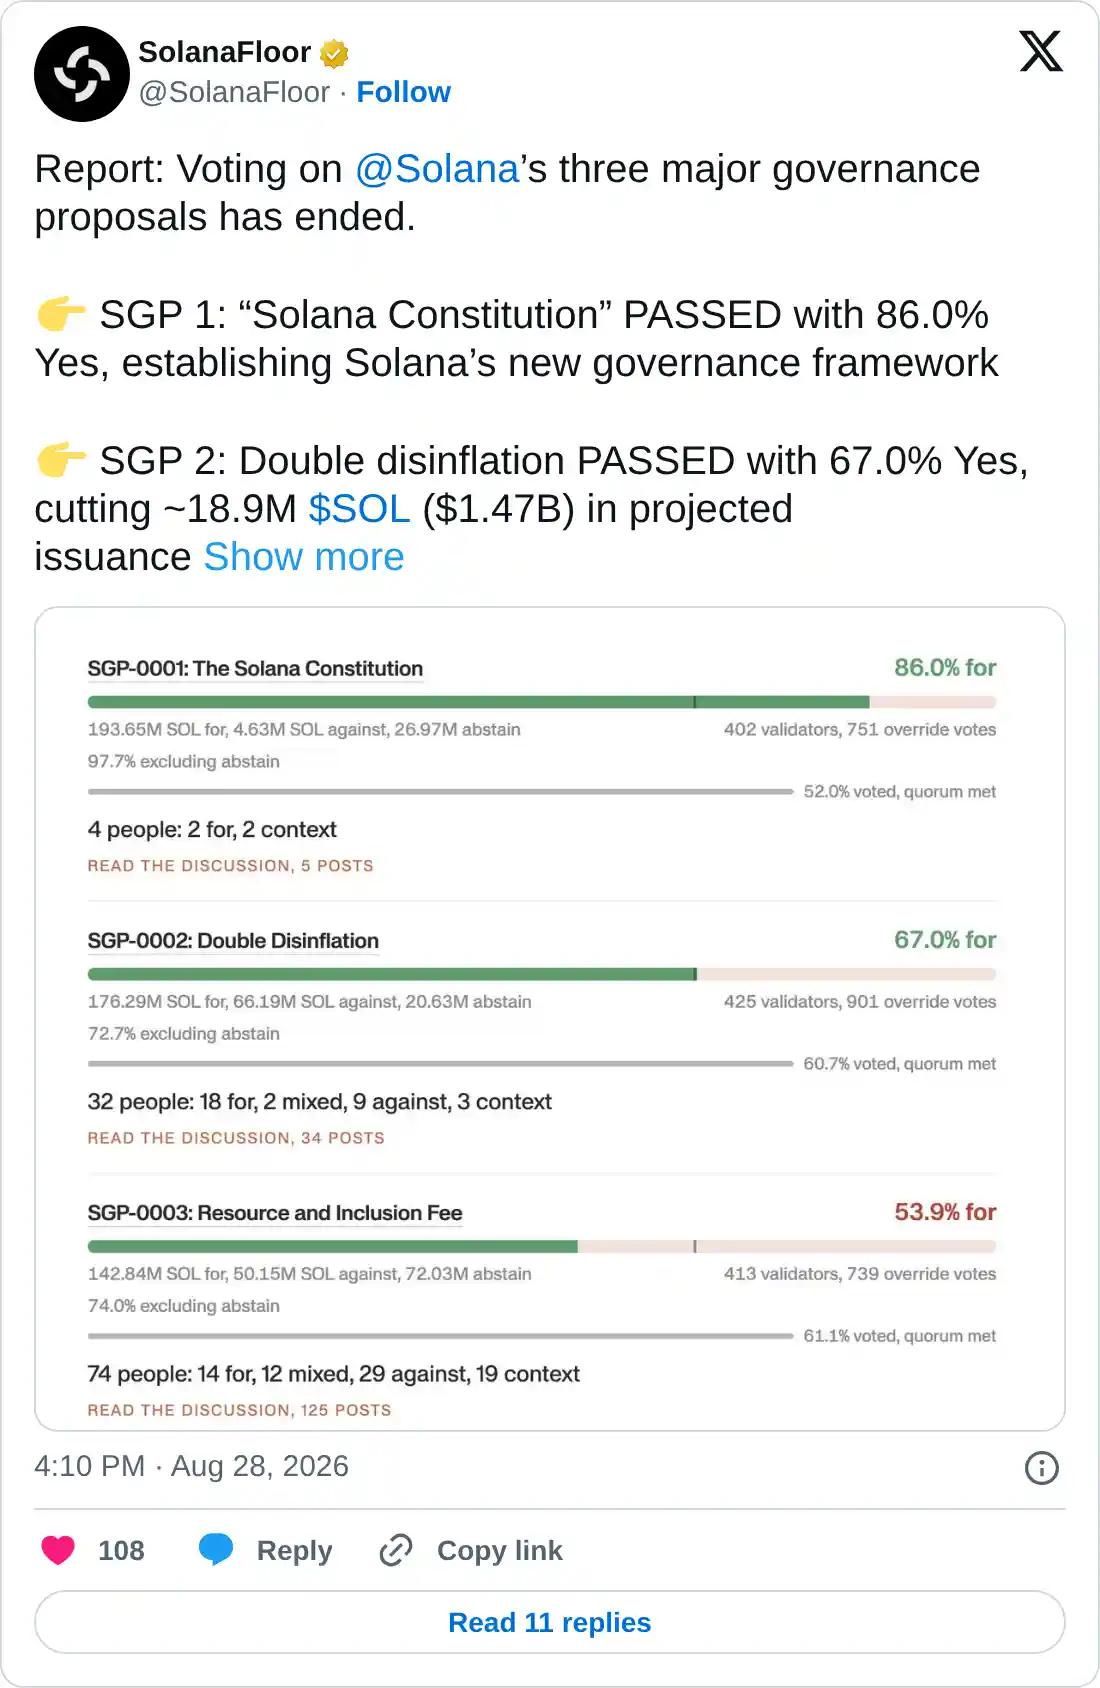
https://x.com/SolanaFloor/status/2093370745854529747

Technical outlook: Will SOL price sustain above $100?

Solana trades around $101.59 at press time on Monday, maintaining a constructive bullish bias. SOL holds above the 50-day Exponential Moving Average (EMA) at $85.05, the 100-day EMA at $82.77, and the 200-day EMA at $89.71, all of which sit below the market, hinting at a well-supported uptrend structure.

Momentum remains firm, with the Relative Strength Index (RSI) down to 67 on the daily chart from overbought conditions, showing easing buying pressure. At the same time, the Moving Average Convergence Divergence (MACD) edges lower toward the signal line, reaffirming reduced buying pressure.

On the topside, the next notable hurdle is the December 18 low at $116.88, which represents a significant structural barrier to any extended rally.

Chart Analysis SOL/USDT (Binance)
SOL/USDT daily price chart.

On the downside, immediate technical support is at the February 1 low of $98.02, followed by the 200-day EMA at $89.71 and the 50-day EMA at $85.05.

(The technical analysis of this story was written with the help of an AI tool. Know more.)

Disclaimer: The content available on Mitrade Insights is provided for informational and marketing purposes only. It has not been prepared in accordance with legal requirements designed to promote the independence of investment research and is not subject to any prohibition on dealing ahead of the dissemination of investment research
Nothing in this material constitutes investment advice, personal recommendation, investment research, an offer, or a solicitation to buy or sell any financial instrument. The content has been prepared without consideration of your individual investment objectives, financial situation, or needs, and should not be treated as such.
Past performance is not a reliable indicator of future performance and/or results. Forward-looking scenarios or forecasts are not a guarantee of future performance. Actual results may differ materially from those anticipated.
Mitrade makes no representation or warranty as to the accuracy or completeness of the information provided and accepts no liability for any loss arising from reliance on such information.
placeholder
Top 3 Preisvorhersagen: Bitcoin steigt über 92.000 USD, während Ethereum und Ripple Widerstandsfähigkeit zeigenBitcoin (BTC), Ethereum (ETH) und Ripple (XRP) notieren am Montag im Plus und treiben eine breitere Erholung des Kryptowährungsmarktes voran. Bitcoin und Ethereum setzen ihre Gewinne am zweiten aufeinanderfolgenden Tag fort und überschreiten 92.000 USD bzw. 3.100 USD, während XRP sich nahe 2,00 USD stabilisiert.
Author  FXStreet
Jan 12, Mon
Bitcoin (BTC), Ethereum (ETH) und Ripple (XRP) notieren am Montag im Plus und treiben eine breitere Erholung des Kryptowährungsmarktes voran. Bitcoin und Ethereum setzen ihre Gewinne am zweiten aufeinanderfolgenden Tag fort und überschreiten 92.000 USD bzw. 3.100 USD, während XRP sich nahe 2,00 USD stabilisiert.
placeholder
Financial Markets 2026: Volatility Catalysts in Gold, Silver, Oil, and Blue-Chip Stocks—A CFD Trader's OutlookThe financial world is perpetually in motion, but the landscape for 2026 seems to be shaping up to be particularly dynamic. For CFD traders navigating global markets, this heightened volatility could present a distinctive set of challenges and opportunities.
Author  Rachel Weiss
Aug 18, Tue
The financial world is perpetually in motion, but the landscape for 2026 seems to be shaping up to be particularly dynamic. For CFD traders navigating global markets, this heightened volatility could present a distinctive set of challenges and opportunities.
placeholder
Cardano Price Forecast: Bearish outlook strengthens as correction deepensCardano (ADA) is extending its correction, trading below $0.29 at the time of writing on Thursday after posting two consecutive red candlesticks over the previous two days.
Author  FXStreet
Aug 18, Tue
Cardano (ADA) is extending its correction, trading below $0.29 at the time of writing on Thursday after posting two consecutive red candlesticks over the previous two days.
placeholder
Crypto Majors Stall as Bitcoin, Ether, and XRP Struggle to Shake Off Bearish OverhangBitcoin steadies at $70k while Ethereum and XRP face key resistance levels; technicals show bearish MACD crossovers despite oversold RSI conditions.
Author  Mitrade
Aug 18, Tue
Bitcoin steadies at $70k while Ethereum and XRP face key resistance levels; technicals show bearish MACD crossovers despite oversold RSI conditions.
placeholder
Silver Price Forecast: XAG/USD remains sideways around $65, FOMC takes centre stageSilver price (XAG/USD) continues to trade in a limited range at around $65.30 during the European trading session on Tuesday.
Author  FXStreet
Aug 18, Tue
Silver price (XAG/USD) continues to trade in a limited range at around $65.30 during the European trading session on Tuesday.
Related Instrument
goTop
quote