



Nvidia Stock Price Prediction: Nvidia Dives Over 4% From Highs, Can It Hit New Highs Again?
TradingKey - On August 31, Eastern Time, AI giant Nvidia (NVDA) shares extended their pullback, dropping 0.12% in overnight trading to $217.19. Last Friday (August 28), Nvidia shares continued to fall, plunging 4.57% to close at $217.55. This large bearish candlestick dealt a heavy blow to market expectations for a bullish push to new highs.
Why Is Nvidia Stock Falling?
Nvidia's stock price experienced a downward correction last Friday, driven primarily by profit-taking in tech stocks triggered by macroeconomic headwinds, rather than operational issues at Nvidia itself. Federal Reserve (Fed) Chair Warsh delivered a hawkish speech at the Jackson Hole annual central banking symposium, warning that sticky services inflation and a still-tight labor market leave limited room for central bank rate cuts.
The hawkish signals released by Warsh rapidly cooled rate-cut expectations, directly hammering rate-sensitive megacap tech and semiconductor stocks. The S&P 500, Nasdaq 100, and Philadelphia Semiconductor Index (SOX) all plunged across the board that day, while prompting some capital in Nvidia to lock in profits. Nvidia's earnings report released after the bell on August 26 significantly exceeded expectations, driving an explosive surge of nearly 9% in its stock price the next day to close at $227.98, just shy of its all-time high of $236, which resulted in a heavy concentration of profit-taking positions in its trading structure.
Can Nvidia Stock Continue to Rise to New Highs?
Nvidia possesses long-term fundamental momentum to reach new record highs, as reflected in its CUDA software ecosystem, NVLink networking technology, and strong profitability with gross margins remaining above 70%. However, in the short to medium term, it faces pressure from high valuation adjustments and macroeconomic interest rate volatility. As its revenue base expands, year-over-year revenue growth is gradually slowing, and the market has extremely high expectations for the magnitude of earnings beats, where failing to meet them even slightly can easily trigger profit-taking selling pressure. In addition, CoWoS advanced packaging capacity and high-bandwidth memory (HBM) supply conditions continue to constrain shipment speeds.
From a technical analysis standpoint, Nvidia's stock price dropped sharply after approaching its historical high, engulfing part of the gains driven by positive earnings. This reflects that bearish forces hold the upper hand at this level, placing it under further downside pressure. If it further breaks below the key support level of $200, caution is required regarding the risk of a pullback to around the lower band at $190.
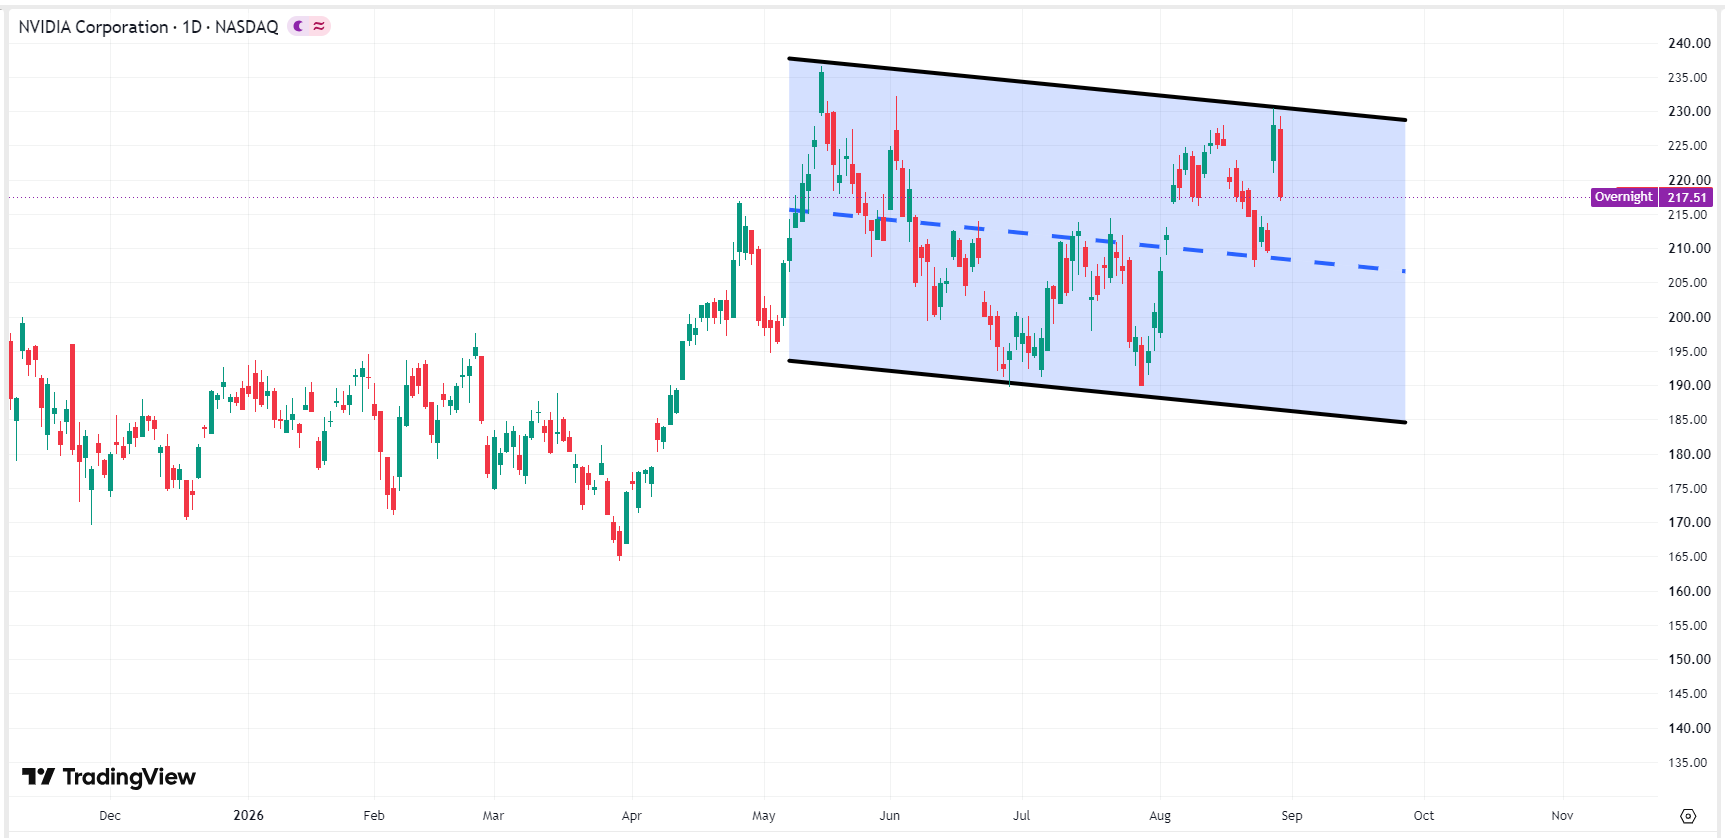 Nvidia stock price chart, Source: TradingView
Nothing in this material constitutes investment advice, personal recommendation, investment research, an offer, or a solicitation to buy or sell any financial instrument. The content has been prepared without consideration of your individual investment objectives, financial situation, or needs, and should not be treated as such.
Past performance is not a reliable indicator of future performance and/or results. Forward-looking scenarios or forecasts are not a guarantee of future performance. Actual results may differ materially from those anticipated.
Mitrade makes no representation or warranty as to the accuracy or completeness of the information provided and accepts no liability for any loss arising from reliance on such information.
Recommended Articles


