



Bitcoin consolidates as spot activity cools, ETF demand remains key to rally
- Bitcoin spot volumes fell 35% last week, but remained above pre-rally levels, suggesting sustained market participation.
- Global Bitcoin ETPs recorded their strongest monthly inflow since November 2024, absorbing 52,152 BTC in August following months of outflows.
- Wintermute identified $82,000 as Bitcoin resistance, with $75,000 and $72,000 as key support levels.
Bitcoin (BTC) began September in a consolidation phase after seeing a sharp rally over the past two weeks. Despite the pullback, the broader market structure remains relatively healthy.
Bitcoin spot market activity cools following rally
In a Tuesday report, K33 noted that Bitcoin's average daily spot volume declined by 35% over the past week to $3.1 billion. However, the decline followed an unusually active period during BTC's 23% rally, meaning market activity remains stronger than it was before the breakout.
"Despite the sharp decline from last week, volumes remain 48% above the July 1 to August 15 average, as BTC’s new trading range has revitalized spot market activity, bringing both buyers and sellers back into the market," K33 wrote.
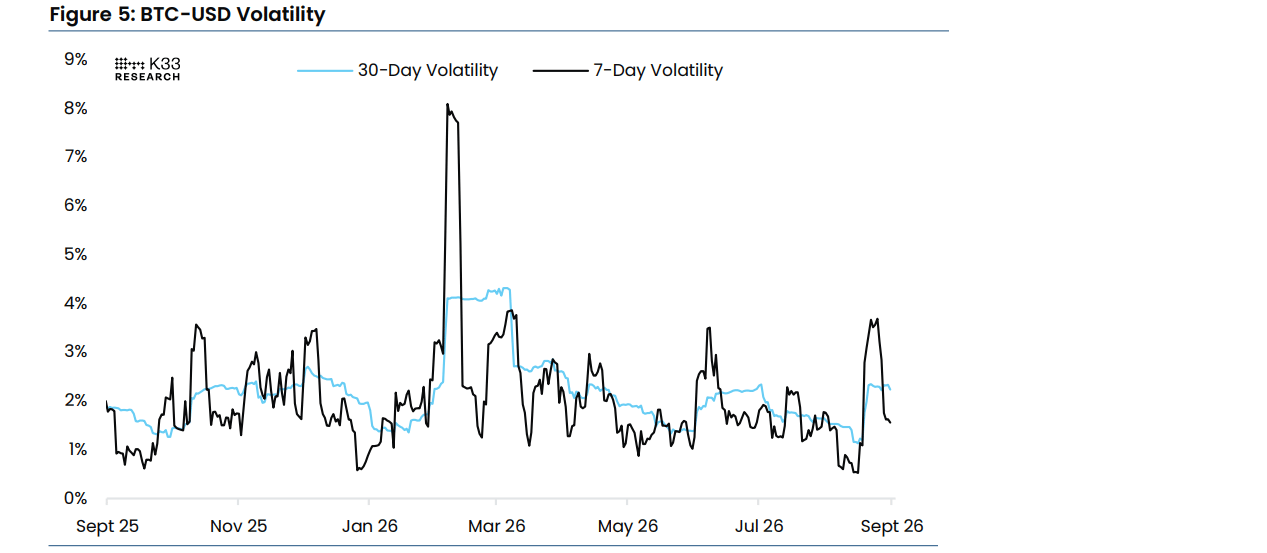
Volatility has also softened, with Bitcoin's seven-day volatility dropping to 1.6%, below its yearly median of 1.8%.
Bitcoin's relationship with traditional assets also became increasingly notable. Its 90-day correlation with gold reached an all-time high of 0.52, while correlation with the Nasdaq fell to a yearly low.
K33 said the changing correlation environment has strengthened the narrative around Bitcoin as a potential "debasement and liquidity hedge."
However, demand through Bitcoin exchange-traded products (ETPs) remains notable. Global Bitcoin ETPs absorbed 52,152 BTC in August, marking the strongest monthly inflow since November 2024. The rebound followed a prolonged period of selling pressure, including record monthly outflows in May and June.
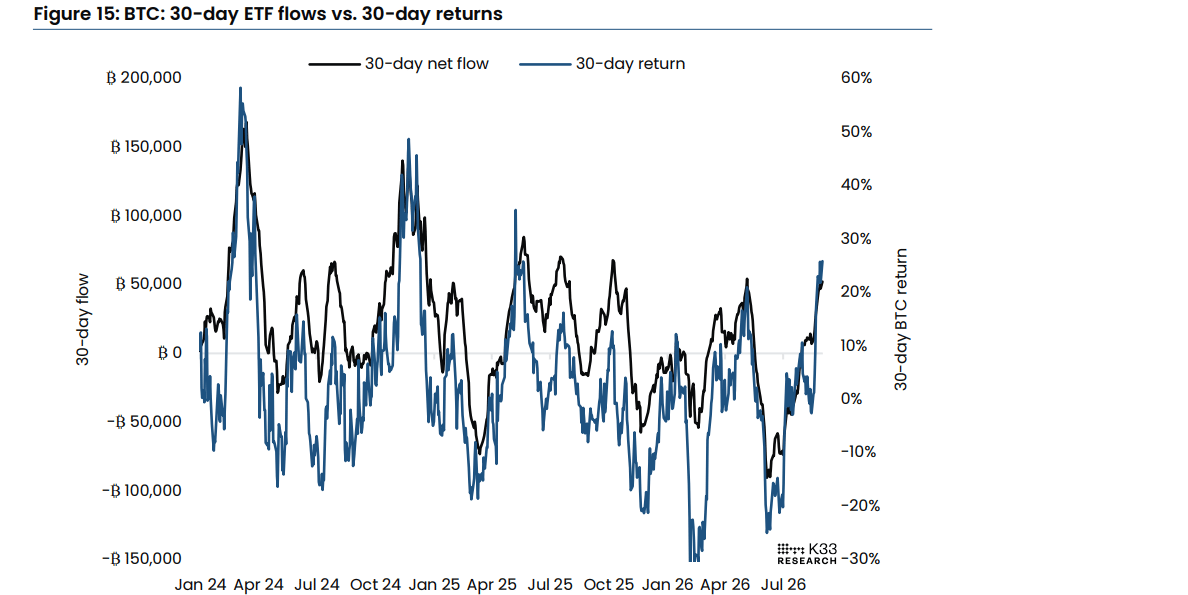
K33 shared that ETF flows have been the clearest driver of Bitcoin's 30-day performance since the launch of spot Bitcoin ETFs, with a correlation of 0.87. As a result, Bitcoin has never recorded a 30-day gain of more than 10% without net ETF inflows.
Bitcoin faces $82,000 resistance, ETF demand remains key to sustained recovery
Wintermute analysts reached a similar conclusion in a Tuesday report, arguing that ETF flows remain central to Bitcoin's ability to sustain its recent recovery.
The top crypto briefly rose above $81,000 before falling below $78,000 following Fed Chair Kevin Warsh's hawkish speech, "digesting its 23% move." BTC eventually finished the week nearly flat, up 0.10%.
"The tape absorbed a hawkish Fed chair, a chip selloff and month-end without giving back the breakout," Wintermute wrote before identifying $82,000 as a key resistance level.
The report argued that under-allocated investors are helping support prices, even as the market struggles to establish a clear short-term direction.
"Consensus has moved to late-stage bear market at minimum and a significant share of investors still feels under-allocated," the firm stated.
According to Wintermute, the bullish scenario depends on those investors continuing to chase Bitcoin. On the other hand, a healthier outcome could involve a pullback toward the mid-$70,000 range to reduce leverage before another move higher.
While $82,000 serves as resistance, Wintermute noted $75,000 and $72,000 as key support levels. The firm also warned that negative ETF flows or a weekly close below $72,000 would weaken the current outlook.
BTC is trading at $77,360, down 1.4% in the past 24 hours at the time of writing.
Nothing in this material constitutes investment advice, personal recommendation, investment research, an offer, or a solicitation to buy or sell any financial instrument. The content has been prepared without consideration of your individual investment objectives, financial situation, or needs, and should not be treated as such.
Past performance is not a reliable indicator of future performance and/or results. Forward-looking scenarios or forecasts are not a guarantee of future performance. Actual results may differ materially from those anticipated.
Mitrade makes no representation or warranty as to the accuracy or completeness of the information provided and accepts no liability for any loss arising from reliance on such information.
Recommended Articles


