



Crypto Overview: US-Iran tensions weigh on Bitcoin – FIL, UNI lead gains
- Bitcoin extends losses below $77,000 on Wednesday, as bullish momentum eases.
- The US and Iran carried out a new round of military strikes on Tuesday, renewing geopolitical tensions.
- Filecoin and Uniswap emerge as top performers over the last 24 hours.
Bitcoin (BTC) is trading below $77,000 on Wednesday, extending losses amid renewed risk-off sentiment, with the US and Iran trading new military strikes the previous day. Filecoin (FIL) and Uniswap (UNI) have emerged as top performers over the last 24 hours.
The US and Iran tensions heat up again
The US Central Command (CENTCOM) carried out fresh strikes against Iran’s Islamic Revolutionary Guard Corps (IRGC) targets early on Wednesday, as previously reported by FXStreet. Renewed US-Iran tensions have lifted the West Texas Intermediate (WTI) to $91.00 at press time.
Bitcoin returns to key support level as momentum eases
Bitcoin trades at $76,799 on Wednesday, maintaining a constructive bullish bias as the price holds well above the 50-, 100-, and 200-day Exponential Moving Averages (EMAs), which are clustered between roughly $69,221 and $72,397.
The recent pullback in the Relative Strength Index (RSI) from overbought readings to about 63 on the daily chart, along with the Moving Average Convergence Divergence (MACD) slipping below its signal line, hints that upside momentum is cooling.
Immediate support appears at the 50% retracement measured from $97,924 to $57,800 near $75,233, followed by the 200-day EMA at about $72,397, with deeper cushions at the 50-day EMA around $70,277 and the 100-day EMA near $69,221.
On the topside, initial resistance aligns with the 78.6% retracement near $87,476, with higher barriers in the cycle-high region near $97,924.
Filecoin regains bullish momentum
Filecoin trades at $0.78 on Wednesday, holding steady after a 14% rise the previous day. FIL holds above the 50-day EMA at $0.73 and tests the 100-day EMA breakout near $0.77, which suggests a mildly bullish near-term bias.
From a technical perspective, the overhead trendline connecting the highs of May 8 and August 22, near $0.82, adds to the upside barriers. A confirmed breakout above $0.82 could target the 50% retracement at $0.89, measured from $1.32 to $0.60, followed by the 200-day EMA at $0.93.
The RSI rebounds to 59, while the MACD crosses above its signal line in positive territory, hinting that upside momentum is building.
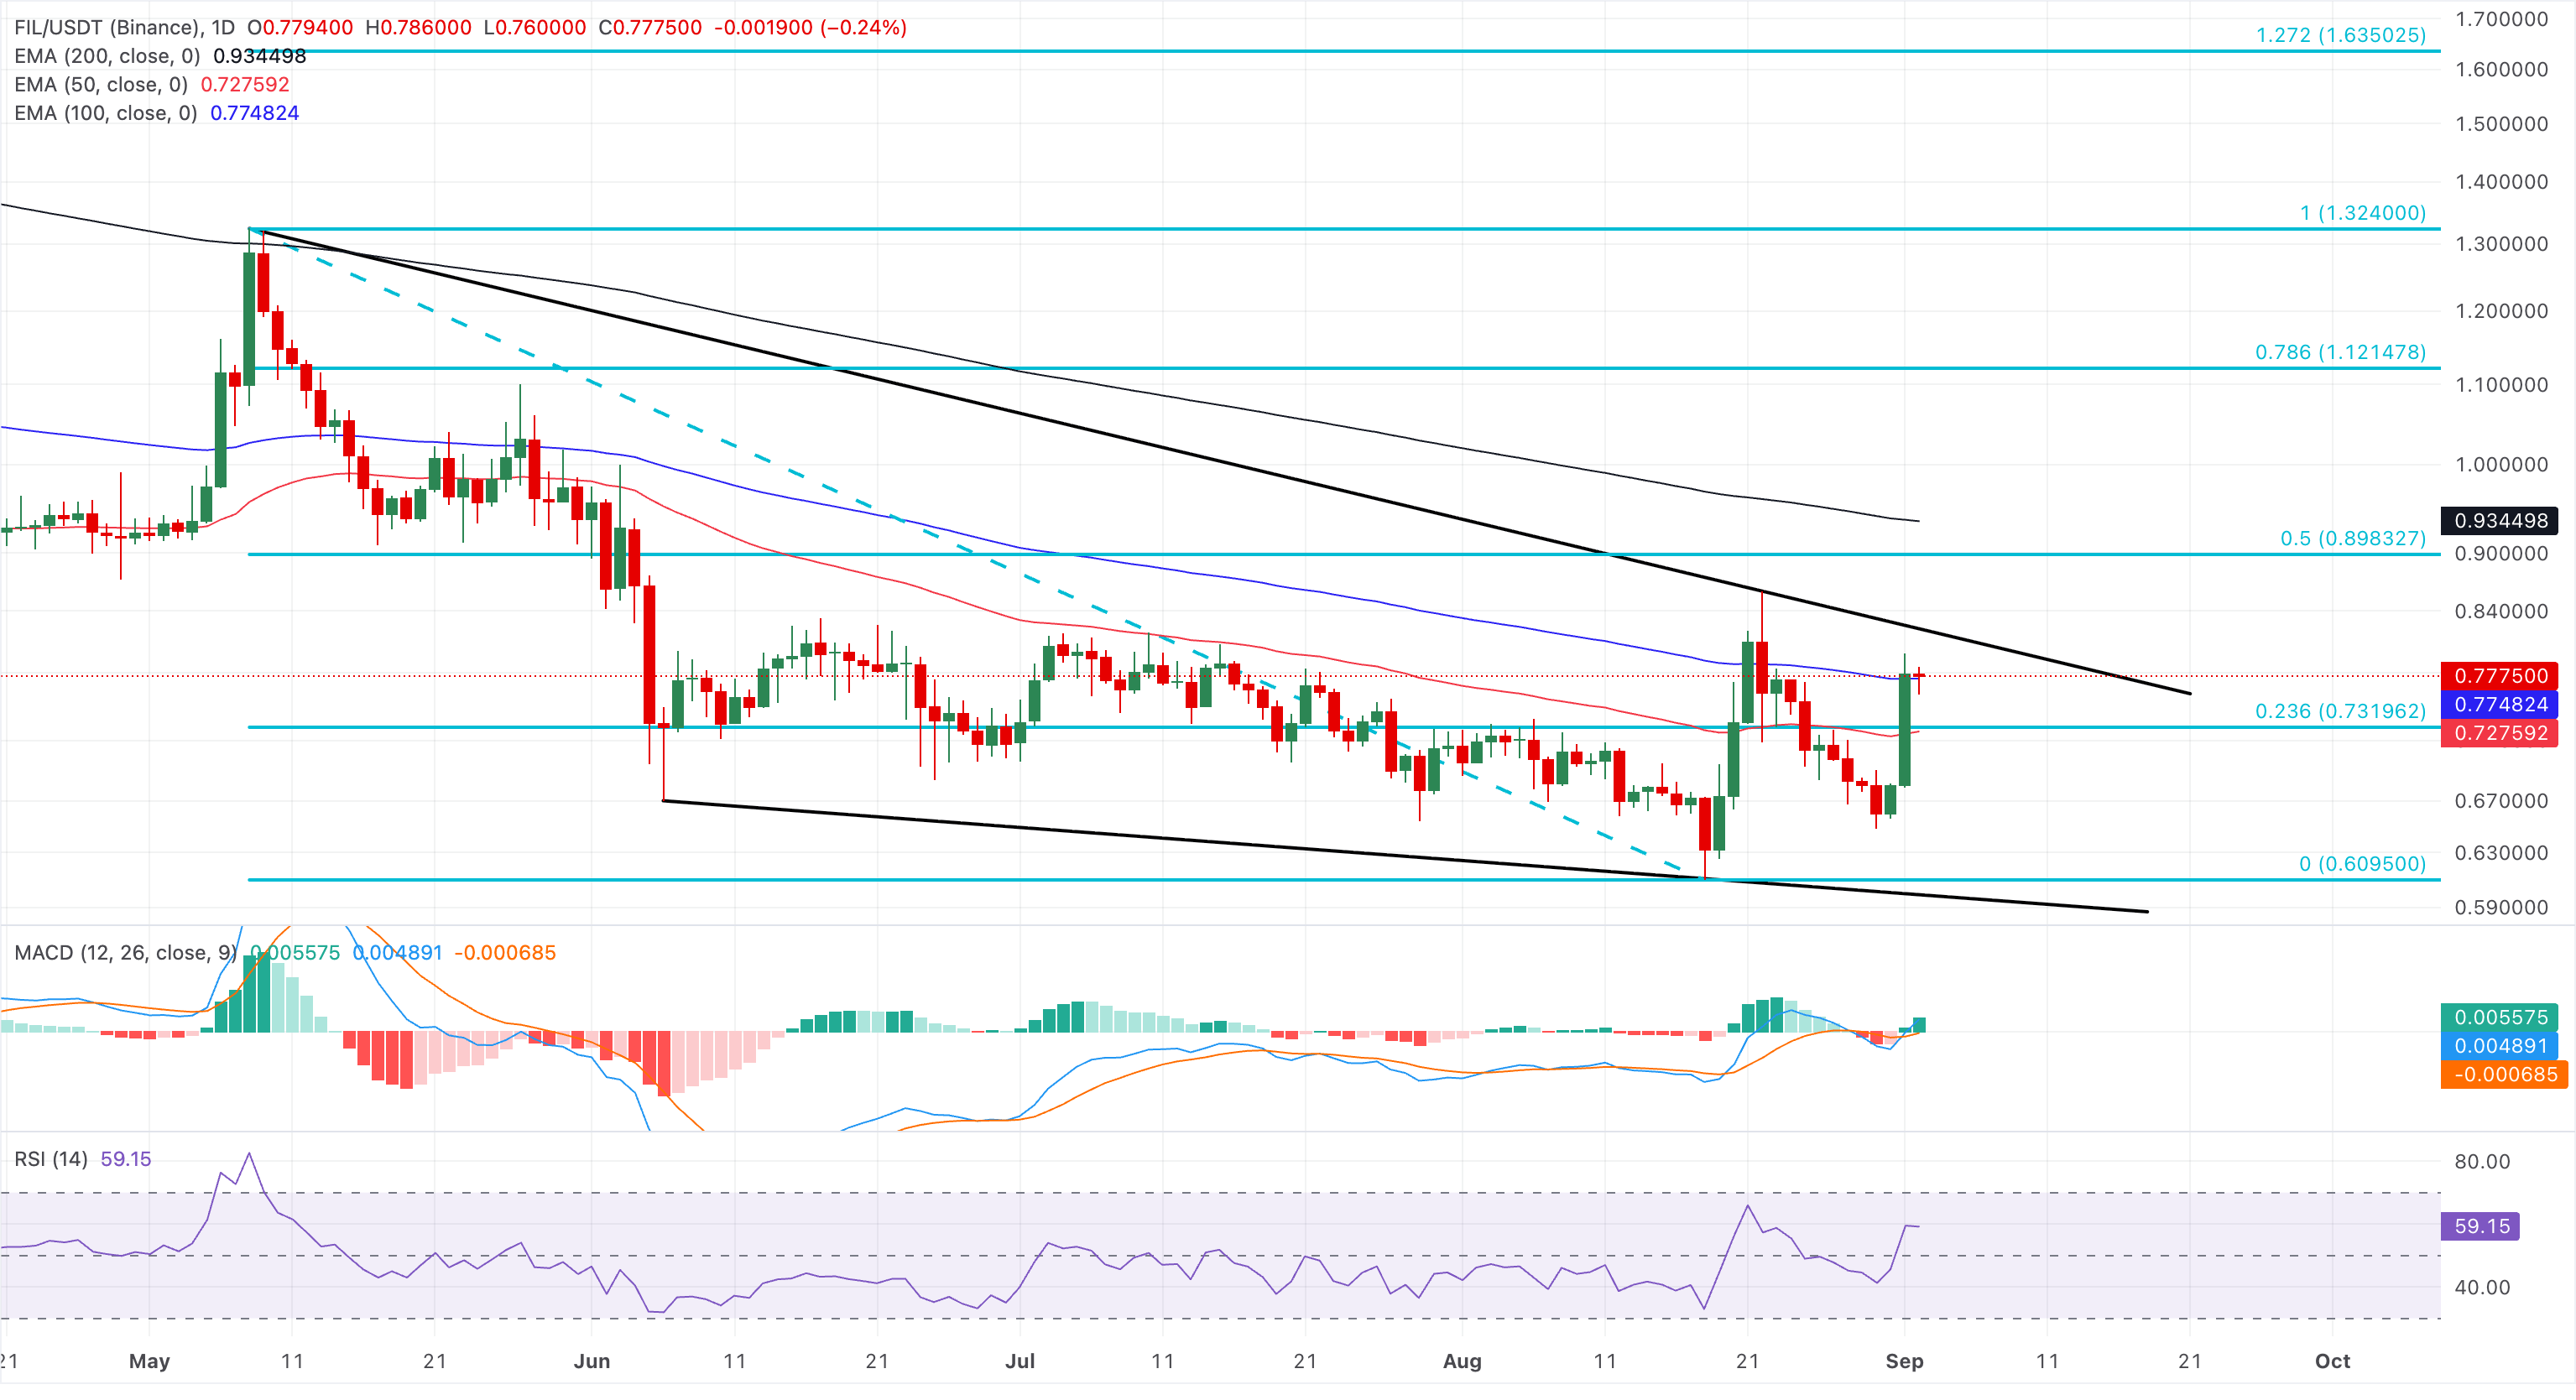
On the downside, initial support emerges at the 23.6% Fibonacci retracement level and the 50-day EMA at $0.73, providing a deeper cushion should buyers lose control.
Uniswap extends rally toward $6
Uniswap trades around $5.83 on Wednesday, maintaining a bullish near-term bias with five consecutive days of gains. UNI holds well above the 50-, 100-, and 200-day EMAs, which are clustered between roughly $3.80 and $4.10.
The RSI near 78 shows overbought conditions, while the MACD and signal line continue to rise, suggesting strong upside momentum even as the rally starts to look stretched.
UNI tests the bullish breakout of the 61.8% level at $5.82, measured from $10.30 to $2.31. A confirmed breakout above this level could target the 78.6% Fibonacci retracement level at $7.48, followed by the previous swing high at $10.30.
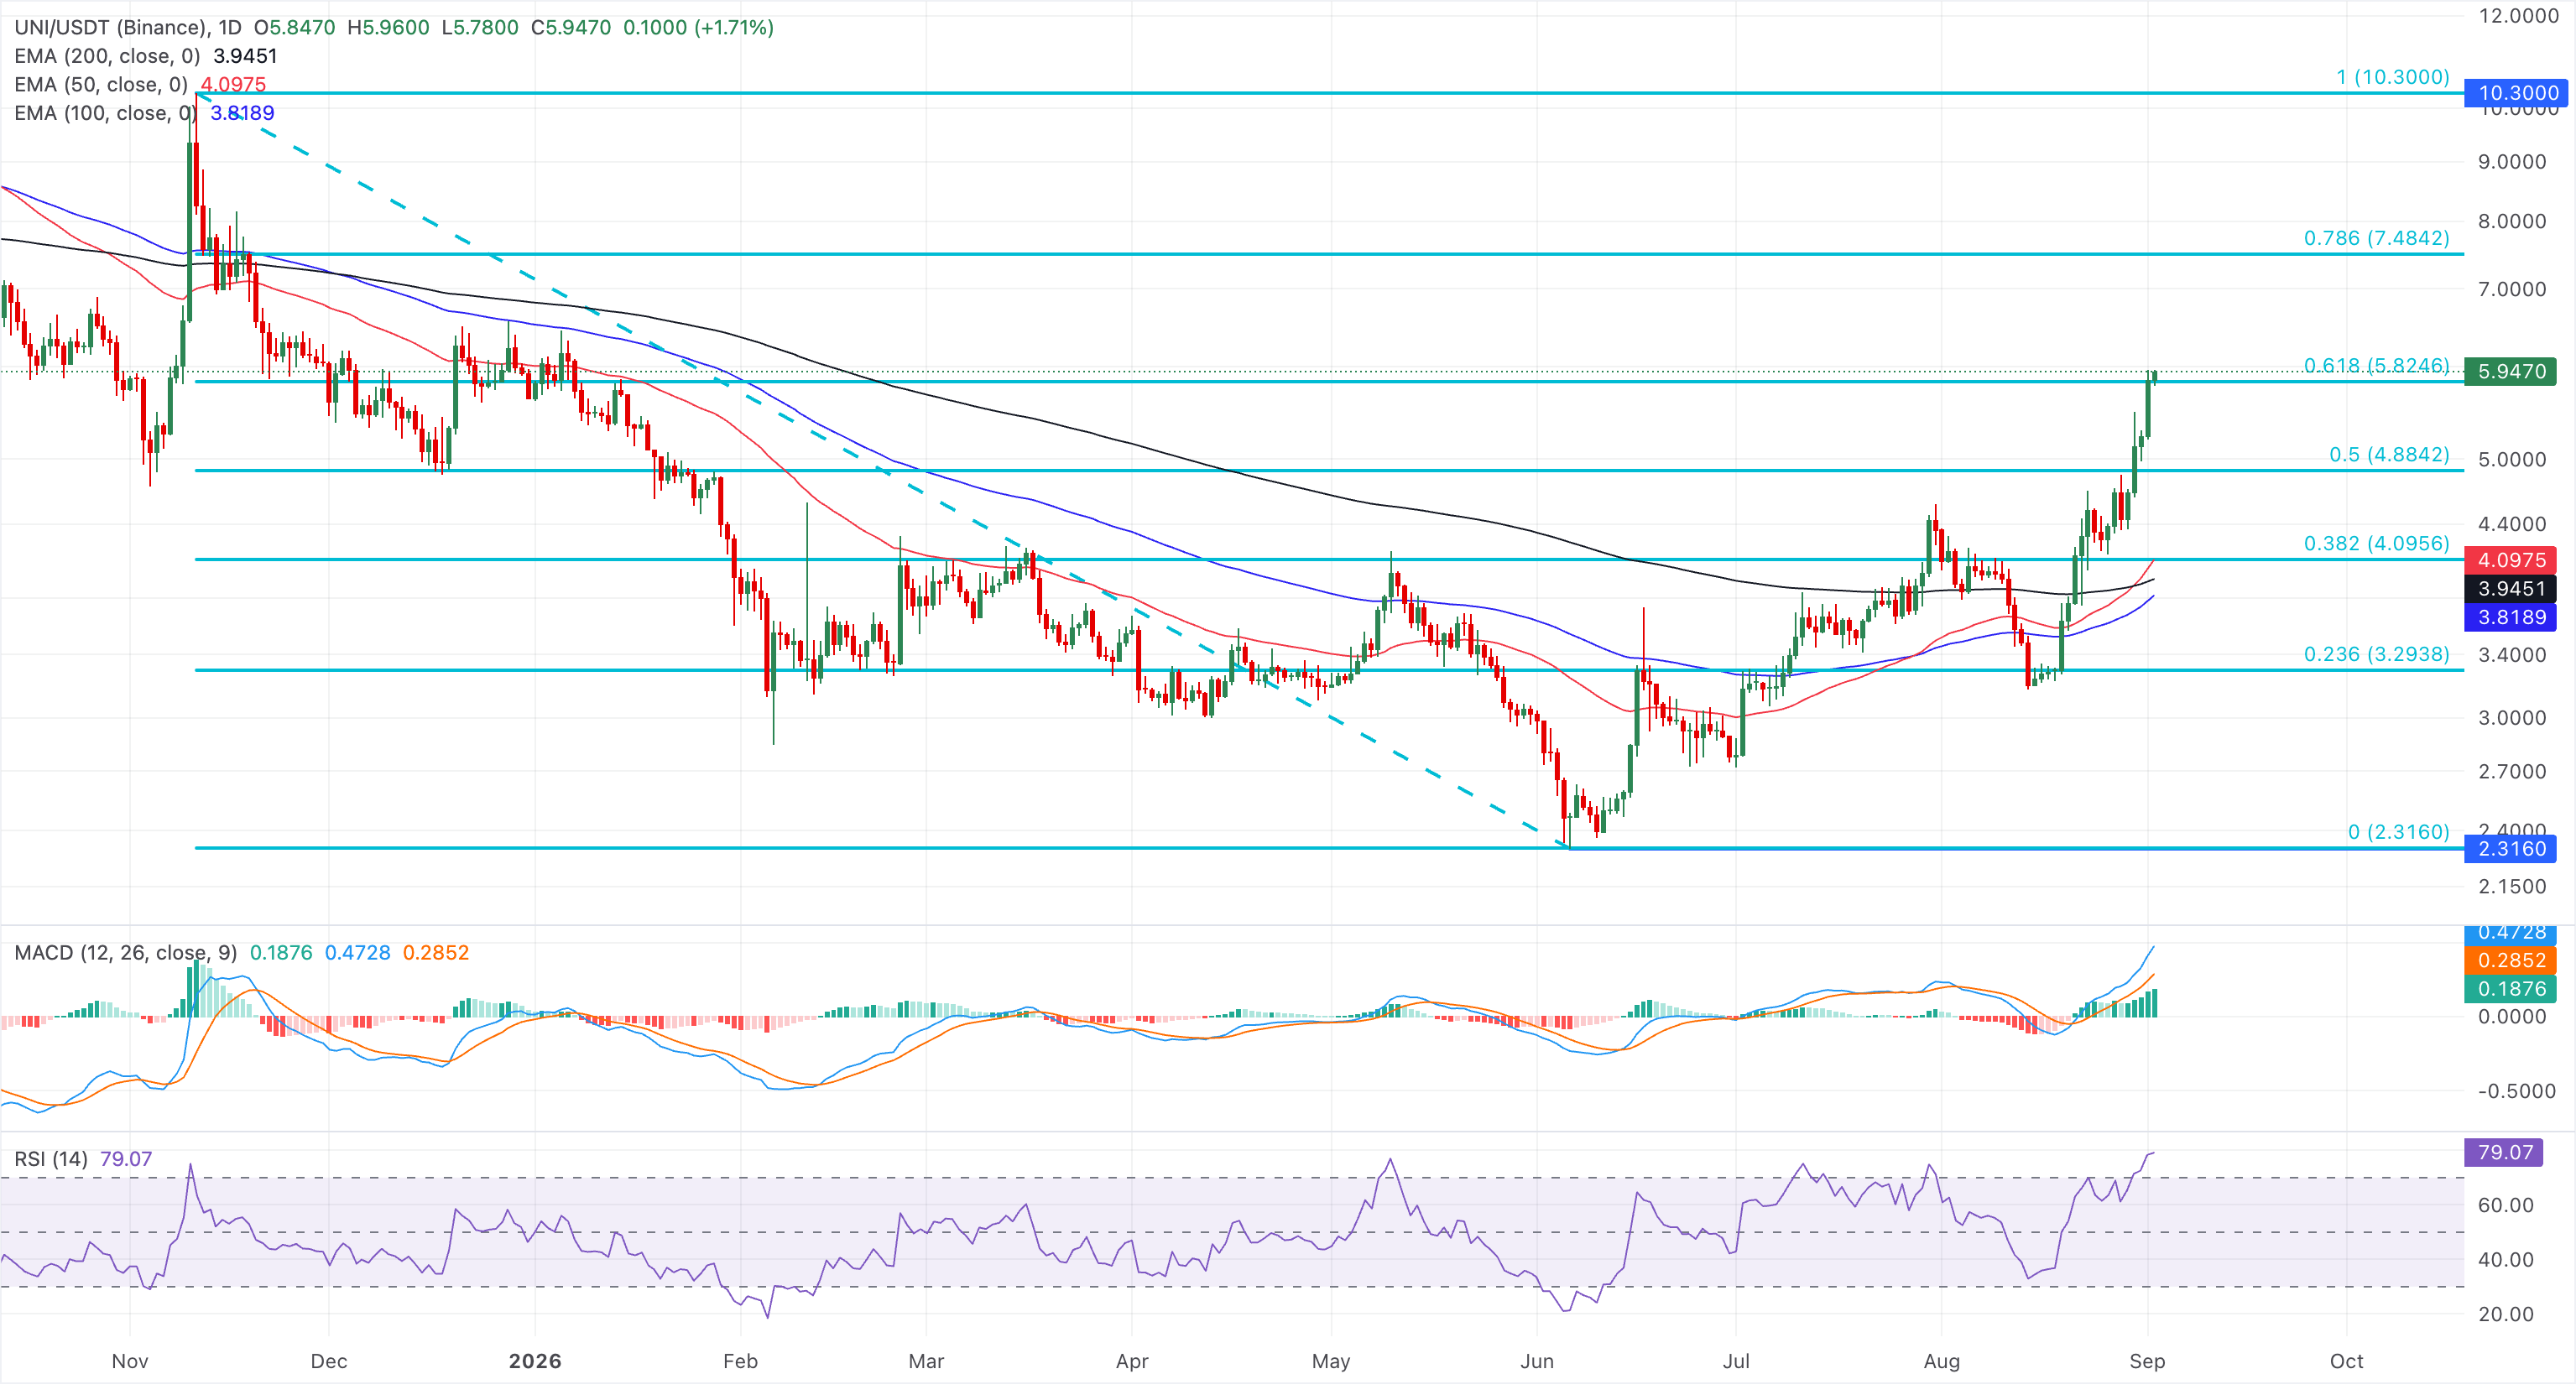
On the downside, initial support emerges at the 50% retracement at $4.88, ahead of a deeper cushion at the 38.2% retracement level and the 50-day EMA around $4.09.
(The technical analysis of this story was written with the help of an AI tool. Know more.)
Nothing in this material constitutes investment advice, personal recommendation, investment research, an offer, or a solicitation to buy or sell any financial instrument. The content has been prepared without consideration of your individual investment objectives, financial situation, or needs, and should not be treated as such.
Past performance is not a reliable indicator of future performance and/or results. Forward-looking scenarios or forecasts are not a guarantee of future performance. Actual results may differ materially from those anticipated.
Mitrade makes no representation or warranty as to the accuracy or completeness of the information provided and accepts no liability for any loss arising from reliance on such information.
Recommended Articles


