



Bitcoin Price Forecast: BTC faces pressure as ETF outflows, Fed rate-hike bets weigh
- Bitcoin remains under pressure, trading around $77,600 on Wednesday after slipping 1.45% the previous day.
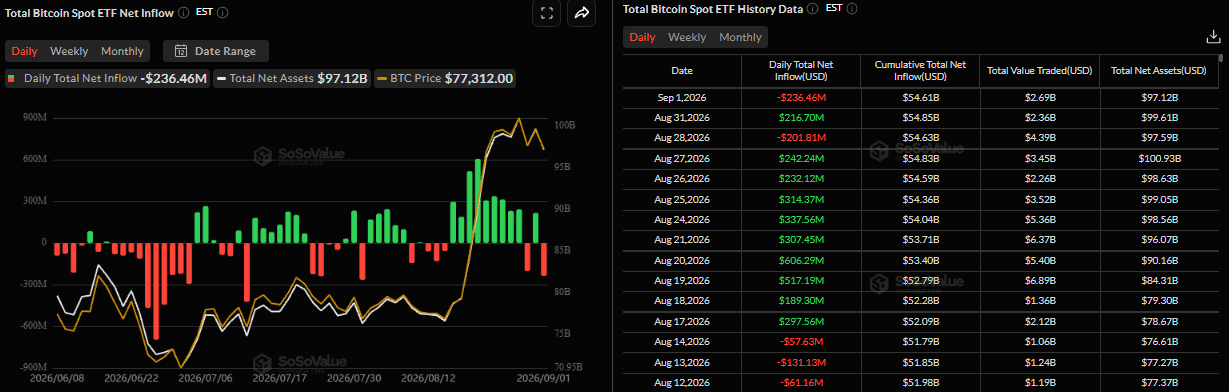
- US-listed spot ETFs recorded an outflow of $236 million on Tuesday, signaling caution among investors.
- Rising energy prices amid fresh US-Iran tensions alongside growing expectations for Fed interest rate hikes could weigh on BTC.
Bitcoin (BTC) remains under pressure, trading around $77,600 on Wednesday, after slipping 1.45% the previous day. Exchange-traded funds (ETFs) record outflows, elevated energy prices amid fresh US-Iran tensions, and rising expectations that Federal Reserve (Fed) interest rate hikes could weigh on the Crypto King’s upside.
Institutional demand shows early caution signs
Institutional demand for Bitcoin shows early signs of weakness. SoSoValue data showed spot ETFs recorded an outflow of $236.46 million on Tuesday, indicating a cautious stance among investors. If these outflows continue and intensify throughout the week, BTC could extend its price correction.
Inflation risk caps BTC
The escalating Middle East conflict has lifted energy prices, with West Texas Intermediate (WTI) reaching a daily high of $90.78 per barrel on Wednesday. Higher crude Oil prices are stoking inflation fears among traders and reaffirming US Federal Reserve (Fed) rate hike bets.
Moreover, on Tuesday, the US Central Command (CENTCOM) said that US forces struck Islamic Revolutionary Guard Corps (IRGC) targets. In response, Iran escalated the confrontation and launched heavy ballistic missile and drone attacks on American interests in Bahrain, Kuwait and Jordan on Wednesday. This keeps the geopolitical risk premium in play, supporting crude and the US Dollar (USD) while dampening risk appetite.
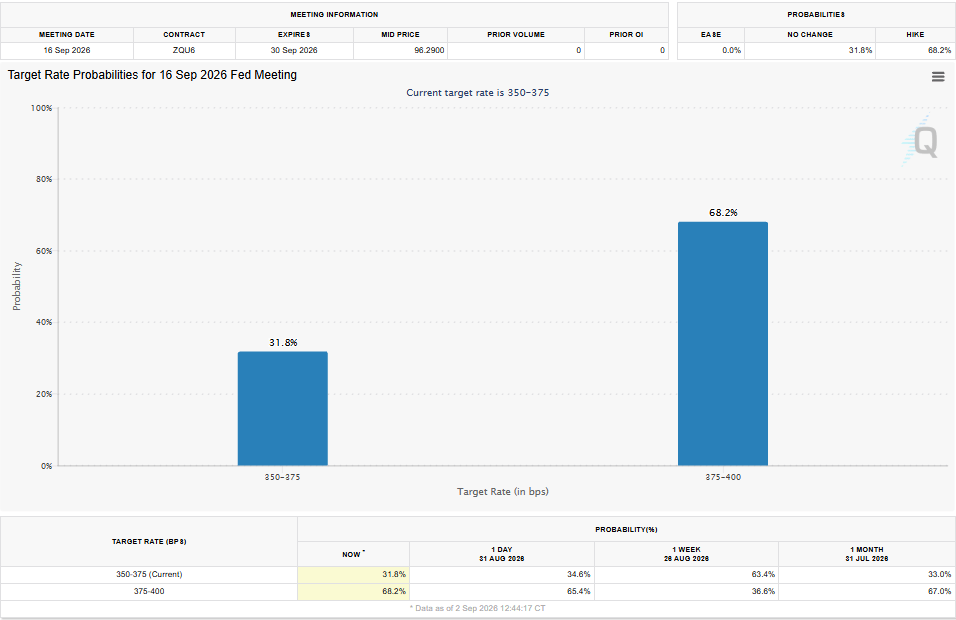
Meanwhile, investors remain worried that elevated energy prices will rekindle inflationary pressures and force major central banks, including the Fed, to adopt a more hawkish stance. Adding to this, Fed Chair Kevin Warsh’s comments at the Jackson Hole Symposium on Friday continue to fuel expectations of a rate hike in September.
According to CME Group’s FedWatch Tool, traders are now pricing in around a 70.2% chance that the Fed will raise borrowing costs at the upcoming policy meeting on September 15-16, up from 41.43% last week on Monday.
This, along with concerns about fiscal debt, led to a deepening global bond market sell-off, pushing the yield on the benchmark 10-year US Treasury to its highest level since January 2025. Higher Treasury yields could weigh on Bitcoin by reducing the appeal of risk assets and increasing the opportunity cost of holding non-yielding assets such as BTC.
Current BTC weakness looks like a liquidity-driven correction
In an exclusive interview, Bitunix Analyst Dean Chen told FXStreet that the current weakness looks more like a liquidity-driven correction than the start of a structural breakdown.
“If the cost of capital eases and ETF flows stabilize, Bitcoin can recover – but until then, macro liquidity remains the dominant constraint,” Dean Chen added.
According to Chen, the recent pullback is driven primarily by elevated interest rates and increased competition for global liquidity, rather than signaling a deeper deterioration in Bitcoin’s market structure.
ETF outflows, higher energy prices and growing expectations that the Federal Reserve may keep rates elevated or tighten further are all increasing the opportunity cost of holding Bitcoin. Higher energy prices are particularly important because, if they reinforce inflation expectations, they could further limit the bank’s ability to ease policy.
However, Chen does not view the current weakness as an automatic signal of an accelerating bear market. A decline in Treasury yields, a less hawkish Fed and stabilization in ETF flows could create room for Bitcoin to recover as broader liquidity conditions improve.
“The key variable is whether global liquidity continues to deteriorate – not simply how far BTC falls in the short term,” Chen said.
At this stage, the analyst thinks the market is repricing, with Bitcoin still searching for a price level that global capital is willing to support in a higher-cost-of-capital environment.
Bitcoin technical outlook: Will BTC fall toward key support?
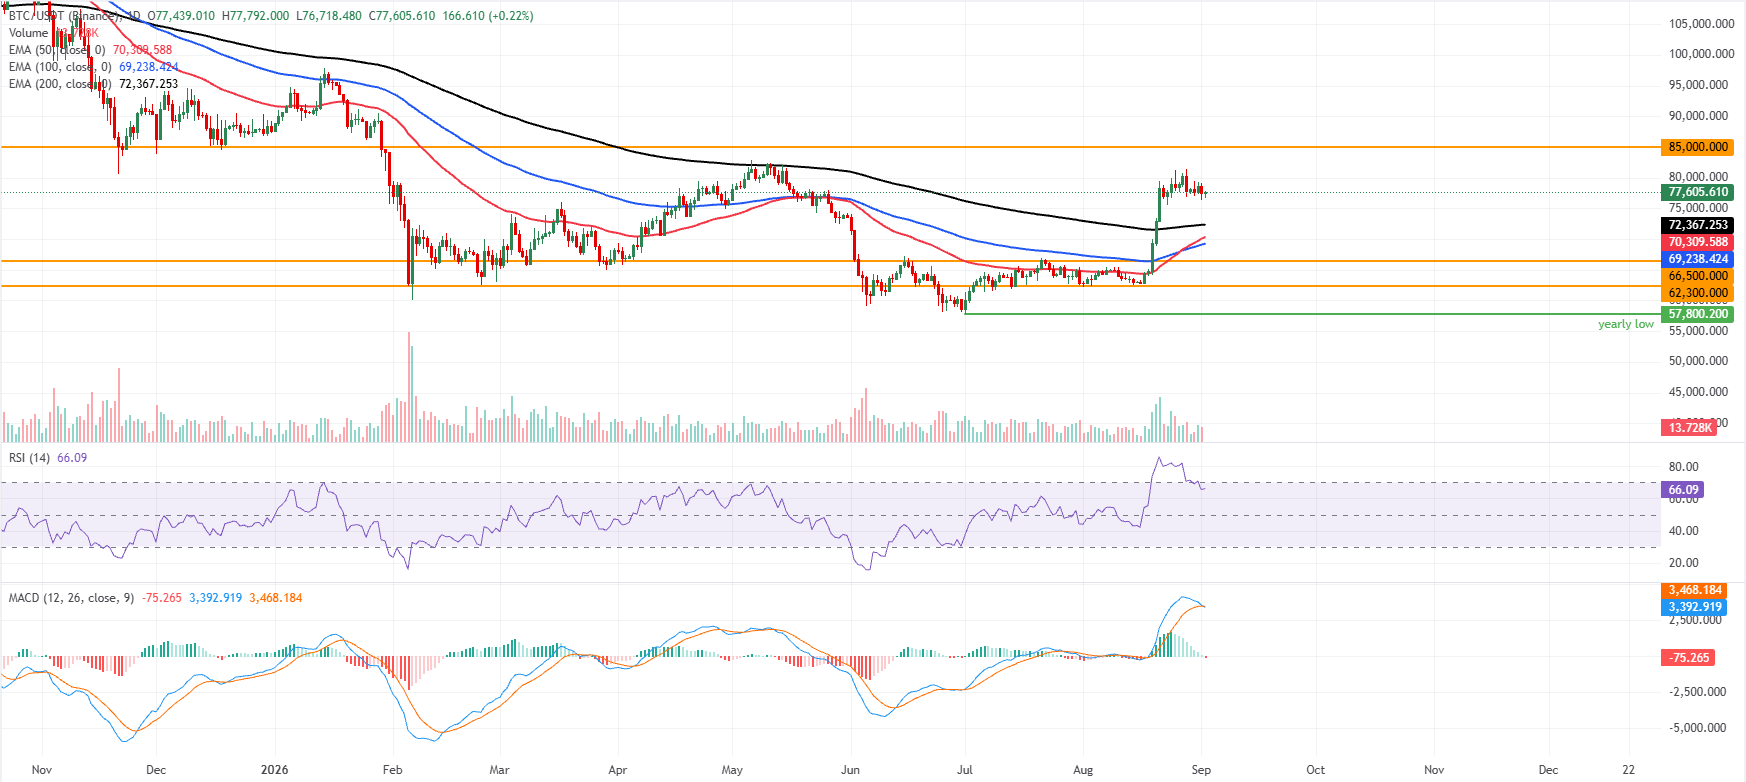
Bitcoin price trades at $77,605 on Wednesday after a mild correction the previous day. Despite the pullback, BTC maintains a bullish near-term bias as price holds well above the 50-day, 100-day, and 200-day Exponential Moving Averages (EMAs), clustered between roughly $69,300 and $72,400.
The Relative Strength Index (RSI) around 66 on the daily chart suggests firm but not overextended buying pressure, even as the Moving Average Convergence Divergence (MACD) has slipped back below the zero line, hinting at slowing upside momentum rather than a full-fledged reversal.
On the downside, initial support is at the longer-term 200-day EMA around $72,367, the 50-day EMA around $70,309, and the 100-day EMA near $69,238, with additional structural floors at $66,500 and $62,300 if a deeper correction unfolds.
On the topside, the next notable resistance aligns with the horizontal barrier at $85,000, and a daily close above this level would reopen the path for the uptrend. In contrast, failure to clear it could encourage further consolidation back toward the EMA support band.
(The technical analysis of this story was written with the help of an AI tool. Know more.)
Bitcoin, altcoins, stablecoins FAQs
Bitcoin is the largest cryptocurrency by market capitalization, a virtual currency designed to serve as money. This form of payment cannot be controlled by any one person, group, or entity, which eliminates the need for third-party participation during financial transactions.
Altcoins are any cryptocurrency apart from Bitcoin, but some also regard Ethereum as a non-altcoin because it is from these two cryptocurrencies that forking happens. If this is true, then Litecoin is the first altcoin, forked from the Bitcoin protocol and, therefore, an “improved” version of it.
Stablecoins are cryptocurrencies designed to have a stable price, with their value backed by a reserve of the asset it represents. To achieve this, the value of any one stablecoin is pegged to a commodity or financial instrument, such as the US Dollar (USD), with its supply regulated by an algorithm or demand. The main goal of stablecoins is to provide an on/off-ramp for investors willing to trade and invest in cryptocurrencies. Stablecoins also allow investors to store value since cryptocurrencies, in general, are subject to volatility.
Bitcoin dominance is the ratio of Bitcoin's market capitalization to the total market capitalization of all cryptocurrencies combined. It provides a clear picture of Bitcoin’s interest among investors. A high BTC dominance typically happens before and during a bull run, in which investors resort to investing in relatively stable and high market capitalization cryptocurrency like Bitcoin. A drop in BTC dominance usually means that investors are moving their capital and/or profits to altcoins in a quest for higher returns, which usually triggers an explosion of altcoin rallies.
Nothing in this material constitutes investment advice, personal recommendation, investment research, an offer, or a solicitation to buy or sell any financial instrument. The content has been prepared without consideration of your individual investment objectives, financial situation, or needs, and should not be treated as such.
Past performance is not a reliable indicator of future performance and/or results. Forward-looking scenarios or forecasts are not a guarantee of future performance. Actual results may differ materially from those anticipated.
Mitrade makes no representation or warranty as to the accuracy or completeness of the information provided and accepts no liability for any loss arising from reliance on such information.
Recommended Articles


