



Crypto Today: Bitcoin, Ethereum, XRP edge lower as renewed US-Iran tensions weigh
- Bitcoin declines for the second consecutive day and tests support at $77,000 as the US and Iran exchange strikes.
- Ethereum retests $2,400 support, pressured by a deteriorating technical structure.
- XRP remains below the 200-day EMA resistance, as the MACD flips bearish and the RSI extends its decline.
The cryptocurrency market is pulling back broadly on Wednesday as investors adopt a cautious stance, with Bitcoin (BTC) consolidating near its short-term support at $77,000.
Ethereum (ETH) remains under pressure, slipping toward $2,400. Ripple (XRP) is also trending lower, approaching its $1.32 support after two consecutive days of losses.
US-Iran strikes reignite risk aversion across markets
Iran has reportedly launched missile and drone attacks on United States (US) military installations in Jordan, Kuwait, Bahrain and Iraq in retaliation for American attacks on Monday and Tuesday.
US Central Command (CENTCOM) reported that recent US strikes on Iran were in response to attempted attacks by Iran’s Islamic Revolutionary Guard Corps (IRGC) targeting commercial vessels in the Strait of Hormuz and US forces stationed in the region, BBC reported.
Iranian attacks on US military sites continue despite US President Donald Trump’s warning that Tehran will face severe strikes if it retaliates.
“They will be hit again at a much harder and higher level, but it will not be the biggest attack of them all, that is waiting in the wings and, when it is over, there will be very little left of the Islamic Republic of Iran!” Trump wrote on Truth Social on Tuesday.
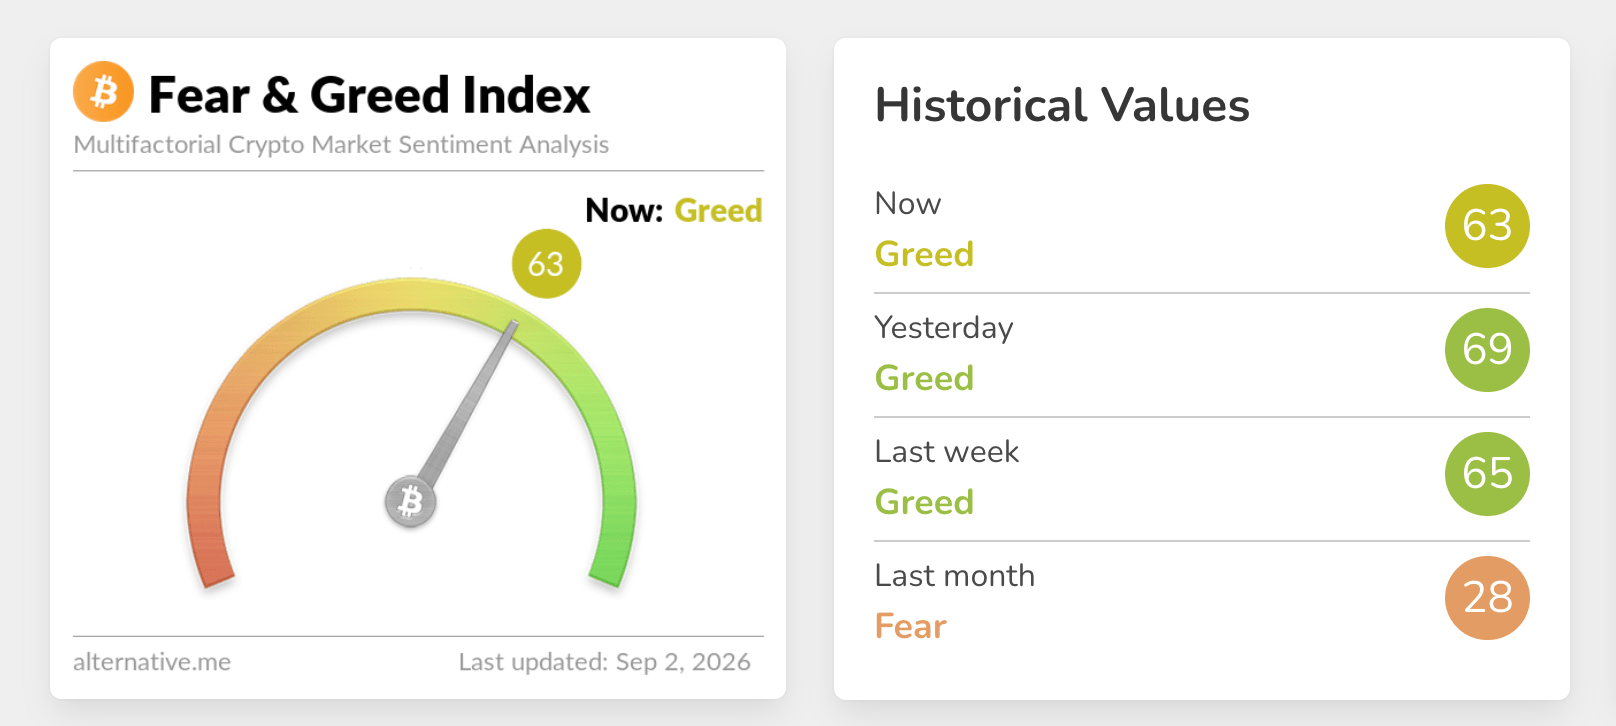
Cryptocurrency prices dropped slightly amid renewed Middle East tensions, aligning with a dip in Fear & Greed sentiment to 63 on Wednesday from 69 the day before. If the decline persists, risk aversion could continue to weigh on price action.
Technical analysis: Bitcoin bullish case weakens
Bitcoin maintains a bullish near-term bias as price holds well above the 50-day, 100-day and 200-day Exponential Moving Averages (EMAs) clustered between roughly $69,200 and $72,300, reinforcing a constructive medium-term structure despite the latest pullback from recent highs.
The Relative Strength Index (RSI) eases from overbought but remains elevated near 64, suggesting strong but moderating upside momentum, while the Moving Average Convergence Divergence (MACD) has turned lower into negative territory, hinting at a loss of immediate upside drive rather than a confirmed trend reversal.
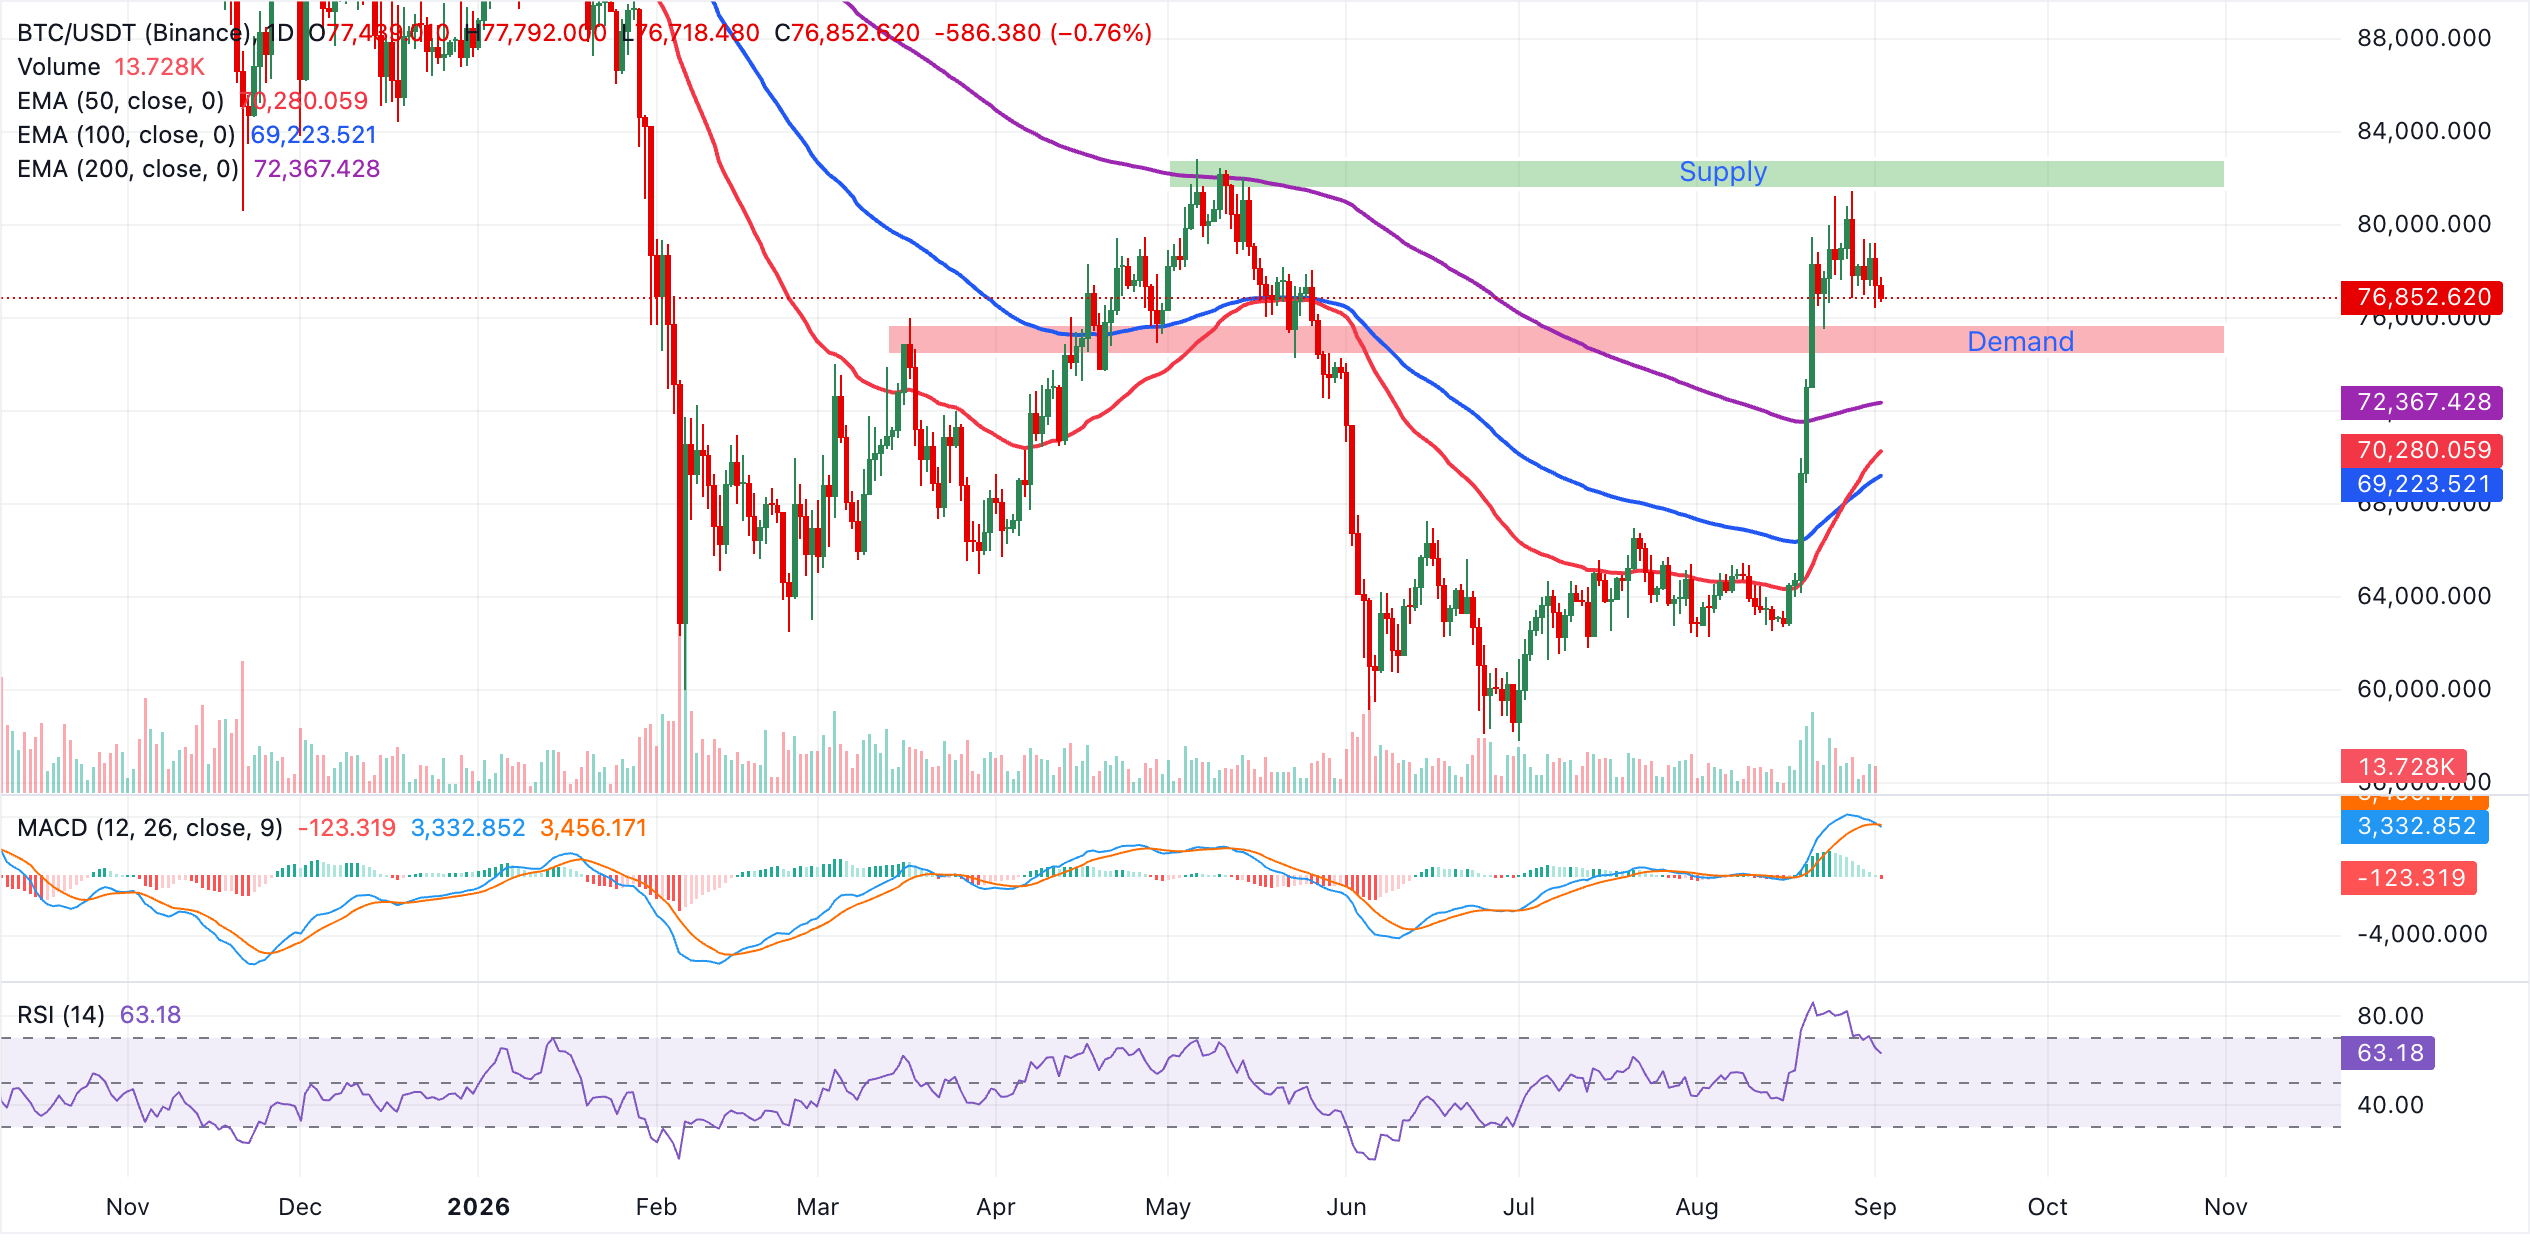
Initial support lies near the psychological $77,000 area around the current pivot, ahead of a more meaningful cushion at the 200-day EMA around $72,367. A deeper correction would expose the 50-day EMA near $70,280 and the 100-day EMA around $69,223 as subsequent demand zones. As long as BTC holds above this moving-average cluster, the broader bullish structure should remain intact, with any dips likely to be viewed as corrective rather than the start of a sustained bearish phase.
Altcoins technical outlook: Ethereum and XRP face downside risk
Ethereum trades at $2,404, maintaining a constructive bullish bias as price holds well above the key EMAs. The 50-day EMA around $2,127 and the 200-day EMA near $2,162 trail the market and suggest an established uptrend, while the 100-day EMA at about $2,053 adds a deeper layer of dynamic support.
Meanwhile, the RSI at roughly 62 points to positive but not overextended momentum, though the MACD has rolled lower into negative territory, hinting at a slowing upside impulse rather than a completed top.
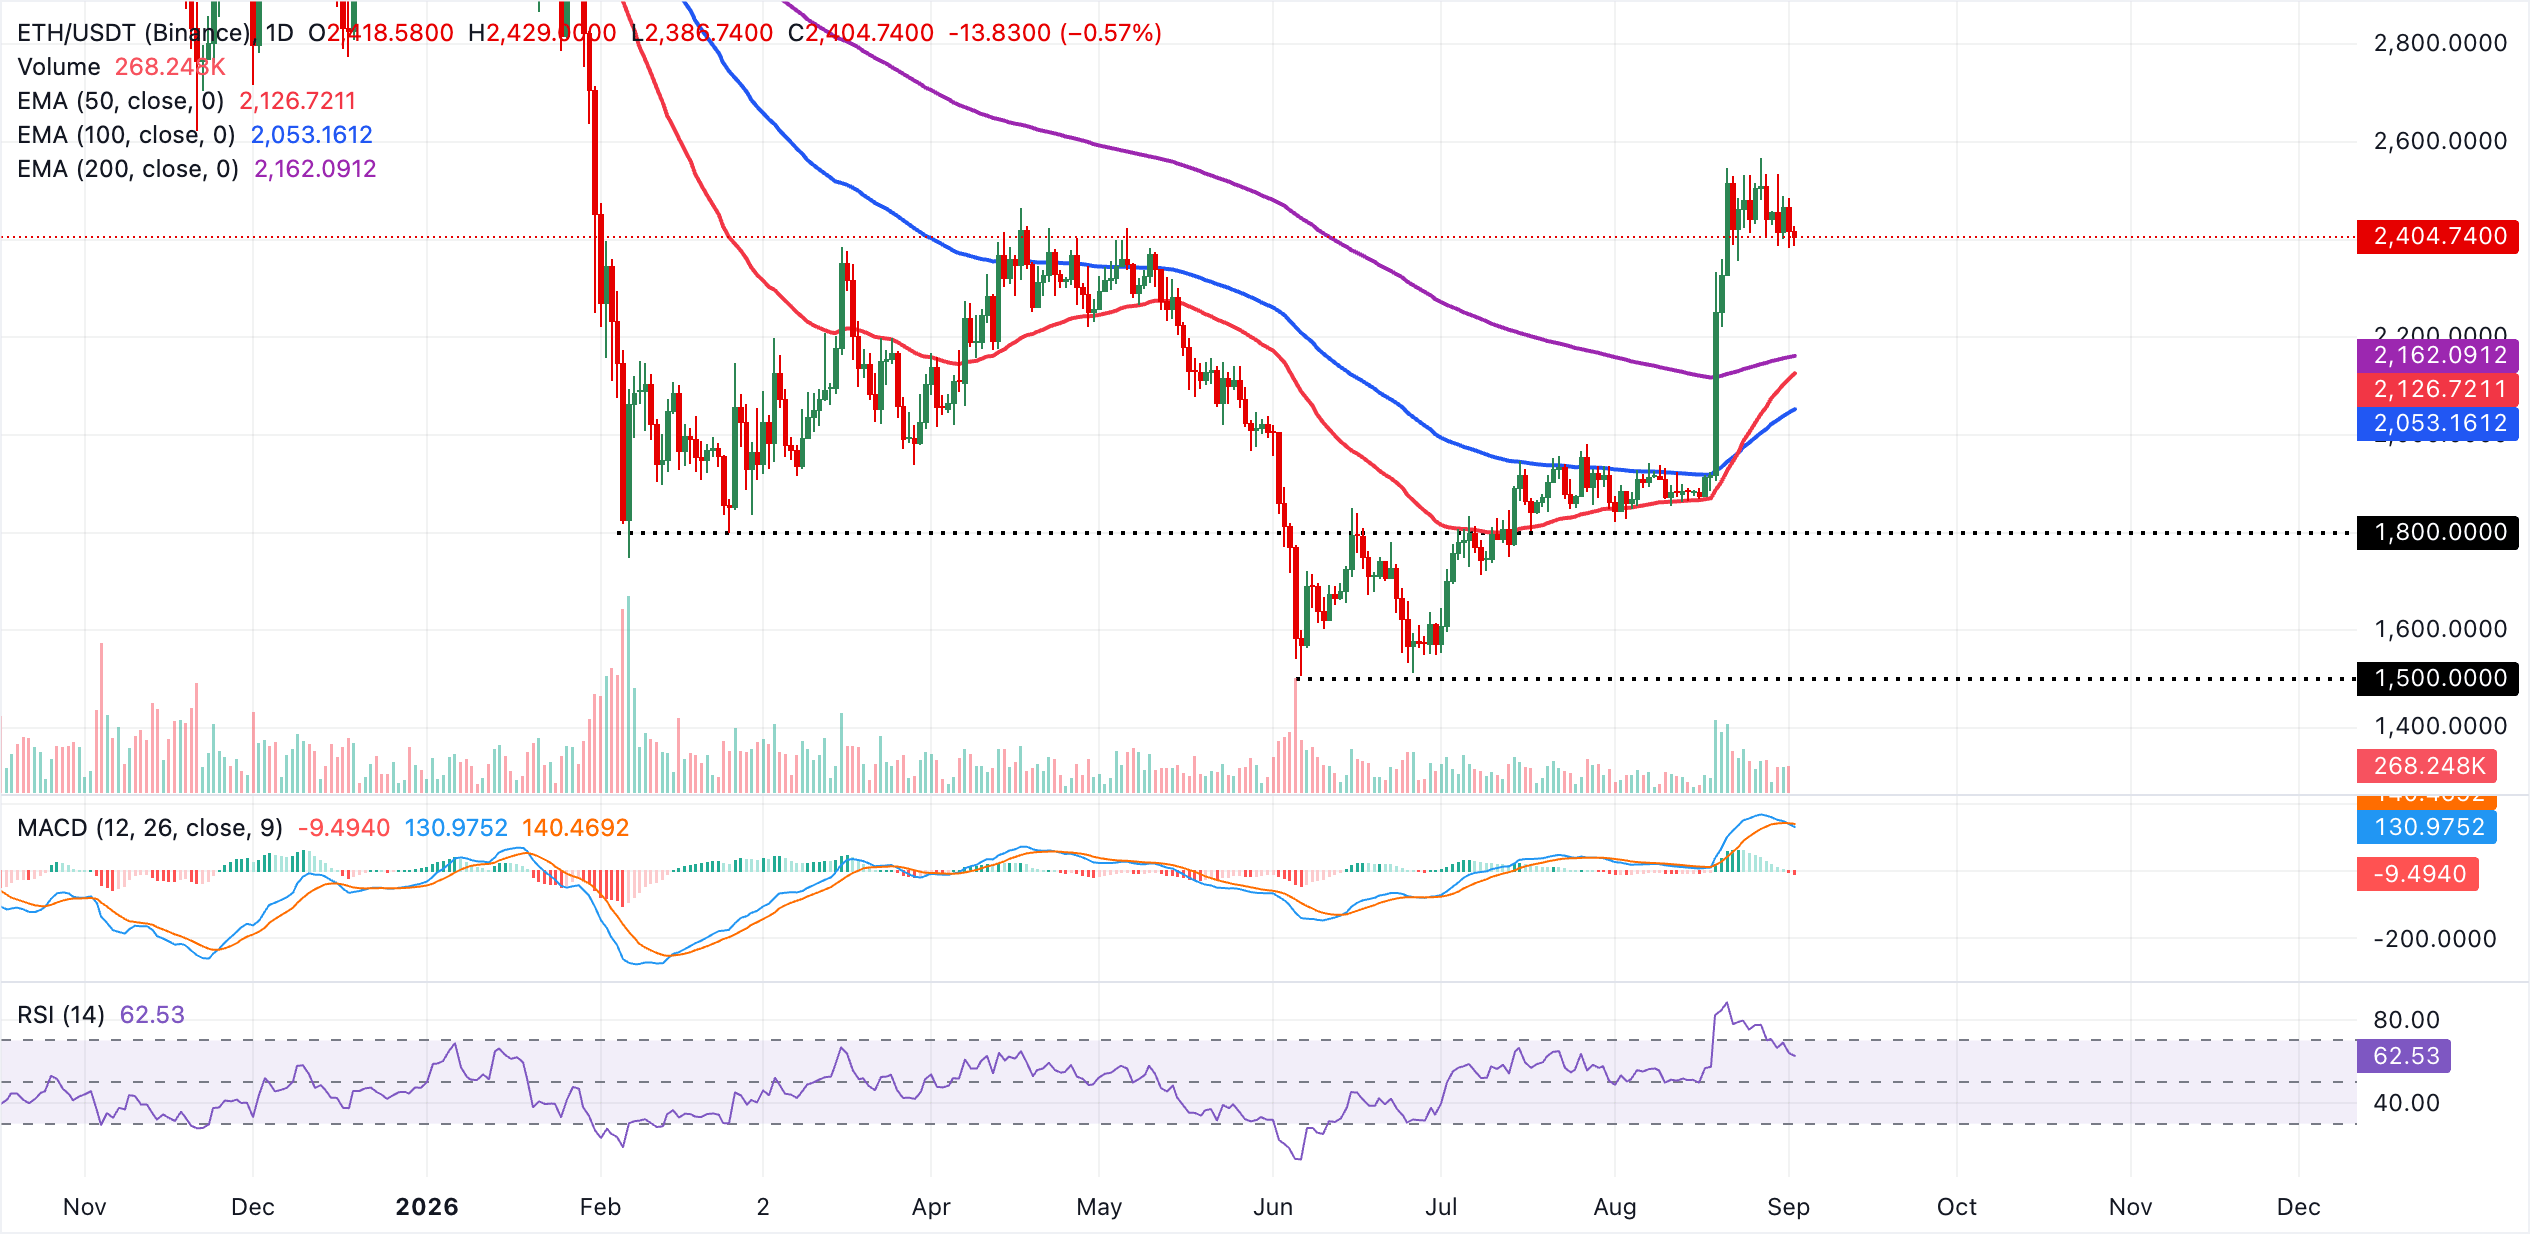
Initial support emerges from the 200-day EMA at $2,162, closely backed by the 50-day EMA near $2,127, forming a supportive zone that could attract dip-buying if ETH pulls back. A deeper slide would expose the 100-day EMA around $2,053 as a more strategic floor for the prevailing trend. With no explicit overhead technical levels in the current daily dataset, near-term resistance is defined by recent price highs rather than mapped indicators, leaving the broader structure tilted toward buyers as long as the pair holds above these clustered EMAs.
XRP, on the other hand, trades at $1.33 and holds above a clustered support area defined by the 50-day and 100-day EMAs near $1.22, suggesting an underlying bid, but it remains below the 200-day EMA at $1.35, which caps the topside and keeps the broader bias neutral rather than decisively bullish.
The RSI around 56 hints at moderate positive momentum, yet the MACD has slipped back into negative territory, suggesting upside follow-through remains fragile as long as price trades below the longer-term EMA barrier.
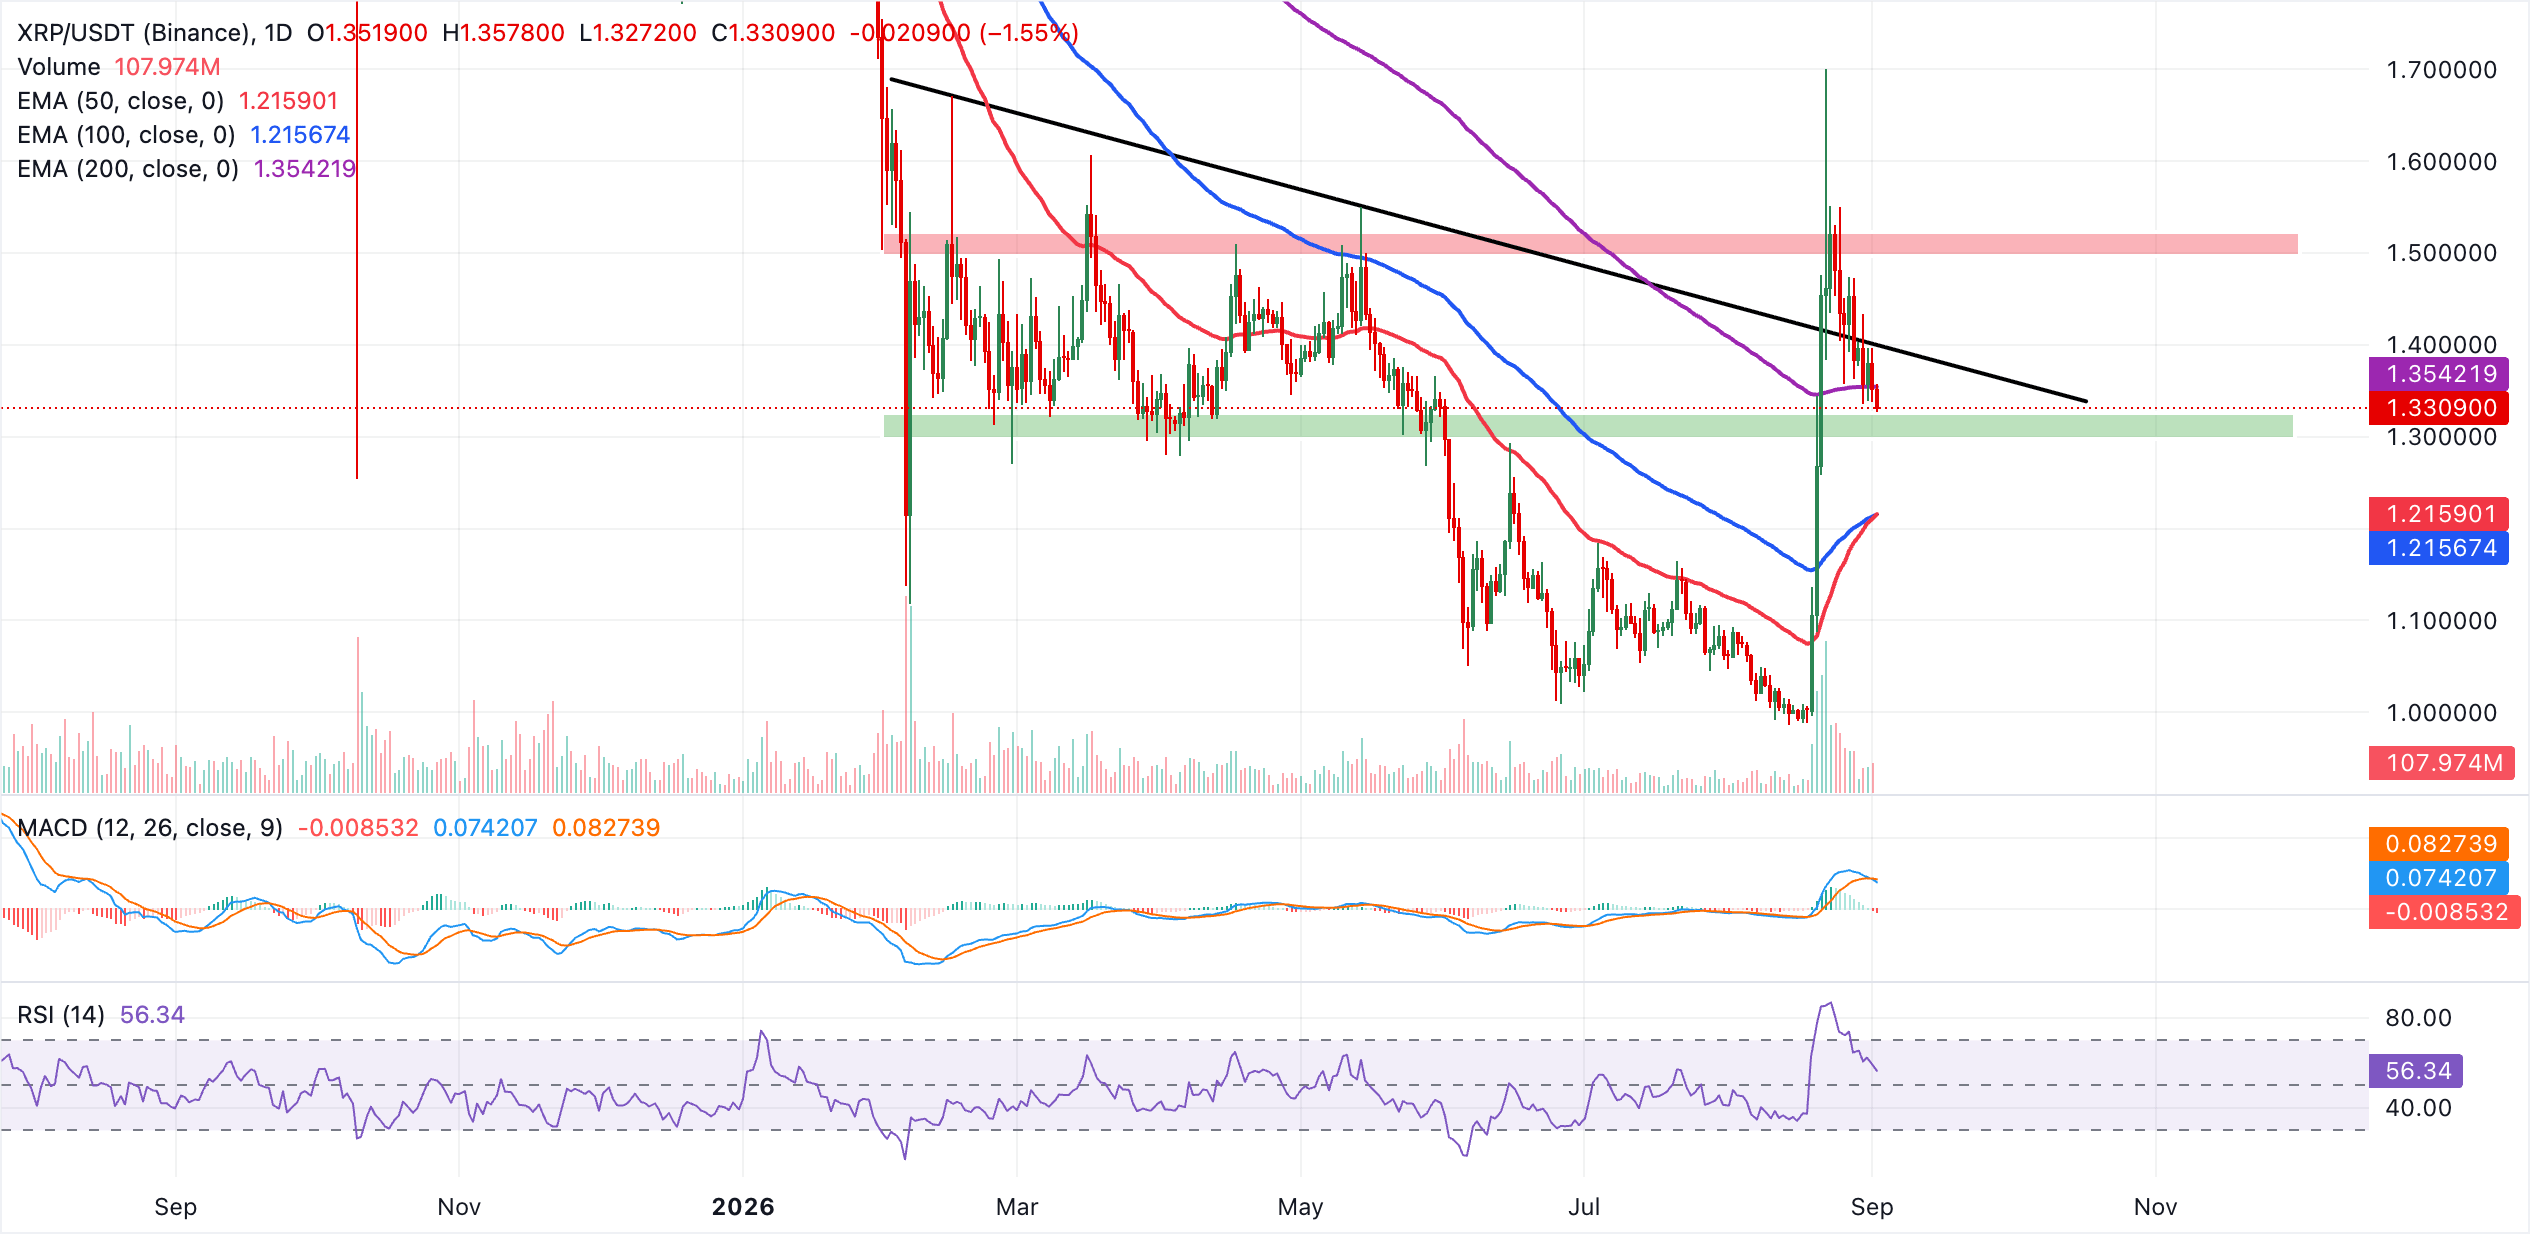
On the topside, immediate resistance sits at the 200-day EMA near $1.35. A reclaim would be needed to open the door to the next obstacle at the broken downward resistance trendline around $1.40. On the downside, initial support comes from the short and medium-term EMA cluster around $1.22, where a decisive break lower would expose a deeper correction and signal that buyers are losing control of the recent advance.
(The technical analysis of this story was written with the help of an AI tool. Know more.)
Bitcoin, altcoins, stablecoins FAQs
Bitcoin is the largest cryptocurrency by market capitalization, a virtual currency designed to serve as money. This form of payment cannot be controlled by any one person, group, or entity, which eliminates the need for third-party participation during financial transactions.
Altcoins are any cryptocurrency apart from Bitcoin, but some also regard Ethereum as a non-altcoin because it is from these two cryptocurrencies that forking happens. If this is true, then Litecoin is the first altcoin, forked from the Bitcoin protocol and, therefore, an “improved” version of it.
Stablecoins are cryptocurrencies designed to have a stable price, with their value backed by a reserve of the asset it represents. To achieve this, the value of any one stablecoin is pegged to a commodity or financial instrument, such as the US Dollar (USD), with its supply regulated by an algorithm or demand. The main goal of stablecoins is to provide an on/off-ramp for investors willing to trade and invest in cryptocurrencies. Stablecoins also allow investors to store value since cryptocurrencies, in general, are subject to volatility.
Bitcoin dominance is the ratio of Bitcoin's market capitalization to the total market capitalization of all cryptocurrencies combined. It provides a clear picture of Bitcoin’s interest among investors. A high BTC dominance typically happens before and during a bull run, in which investors resort to investing in relatively stable and high market capitalization cryptocurrency like Bitcoin. A drop in BTC dominance usually means that investors are moving their capital and/or profits to altcoins in a quest for higher returns, which usually triggers an explosion of altcoin rallies.
Nothing in this material constitutes investment advice, personal recommendation, investment research, an offer, or a solicitation to buy or sell any financial instrument. The content has been prepared without consideration of your individual investment objectives, financial situation, or needs, and should not be treated as such.
Past performance is not a reliable indicator of future performance and/or results. Forward-looking scenarios or forecasts are not a guarantee of future performance. Actual results may differ materially from those anticipated.
Mitrade makes no representation or warranty as to the accuracy or completeness of the information provided and accepts no liability for any loss arising from reliance on such information.
Recommended Articles


