


Top 3 Price Predictions: Bitcoin, Ethereum, Ripple – BTC, ETH and XRP extend losses as downside momentum dominates
- Bitcoin extends losses, down nearly 6% so far this week, slipping below the $70,000 psychological level Friday.
- Ethereum slips below $2,000 as selling pressure intensifies.
- XRP bears remain in control, extending the correction toward the next key zone around $1.
Bitcoin (BTC), Ethereum (ETH) and Ripple (XRP) extend their sell-off on Friday as bearish momentum gathers. BTC breaks below the $70,000 psychological threshold, while ETH loses the $2,000 support level, raising the risk of further losses. Meanwhile, XRP continues to slide as sellers maintain control, threatening a deeper correction toward $1.00.
Bitcoin bears suggest deeper correction
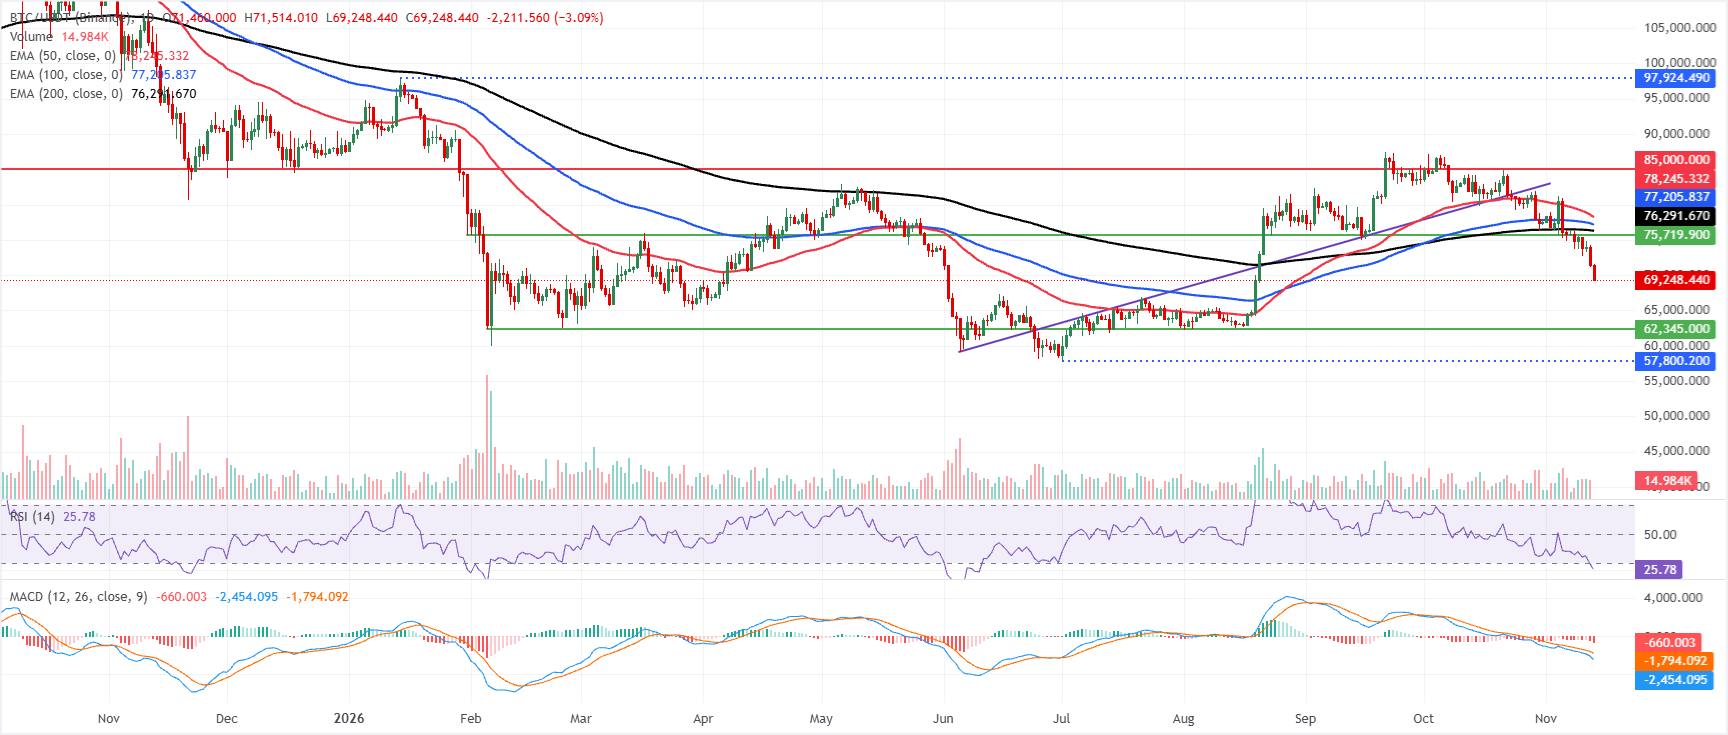
Bitcoin price trades at $69,195 on Friday, extending its decline well below the key Exponential Moving Averages (EMAs). The 200-day EMA at $76,291, the 100-day EMA at $77,205 and the 50-day EMA at $78,245 all sit overhead, reinforcing a bearish near-term bias as BTC retreats away from its prior consolidation band.
The Relative Strength Index (RSI) at 25 has slipped into oversold territory. Meanwhile, the Moving Average Convergence Divergence (MACD) remains deeply negative, suggesting downside momentum is strong even if short-term bounces emerge from stretched conditions.
On the topside, initial resistance sits at the 200-day EMA near $76,291, followed by the 100-day EMA at $77,205 and the 50-day EMA at $78,245, which together define a dense supply zone likely to cap any recovery attempts. A higher horizontal barrier is seen at $85,000, where sellers could reassert control if the pair manages a more pronounced rebound.
With no meaningful support nearby in the current dataset, traders may look to intraday price action and prior swing lows for potential stabilization, while acknowledging that the broader technical structure remains tilted to the downside as long as BTC trades beneath these major EMAs.
Ethereum loses $2,000 support
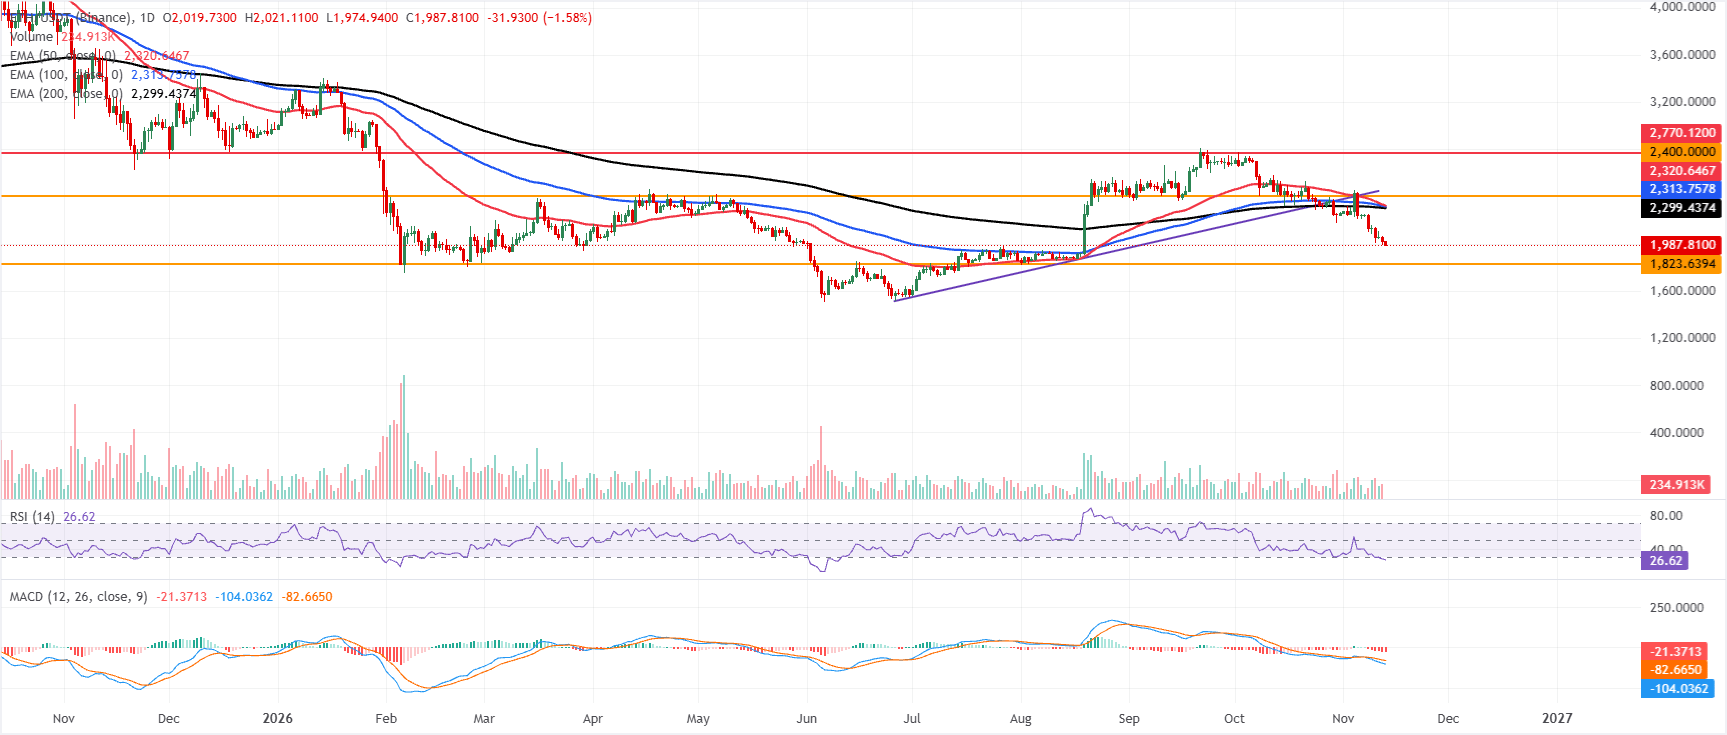
Ethereum price trades at $1,987 on Friday, extending a bearish phase as it holds well beneath the 50-day, 100-day and 200-day EMAs clustered between roughly $2,299 and $2,320. This overhead EMA stack reinforces a capped tone after the pair lost the prior rising support line, now pointing to the trendline break area near $2,459 as a more distant barrier.
Momentum remains weak, with the RSI at about 26 in oversold territory and the MACD below zero and negative, suggesting persistent downside pressure even if short-term selling looks stretched.
On the downside, immediate structural demand is seen at the horizontal support near $1,823, where buyers could attempt to slow the decline if reached.
On the topside, initial resistance emerges at the 200-day EMA around $2,299, followed by the 100-day EMA at $2,313 and the 50-day EMA at $2,320, forming a dense cap ahead of the psychological $2,400 level. Above that, the broken ascending trendline region around $2,459 and the higher horizontal barrier near $2,770 stand as subsequent resistance zones that would need to be reclaimed to revive a more constructive medium-term outlook.
XRP heads toward key $1 psychological level
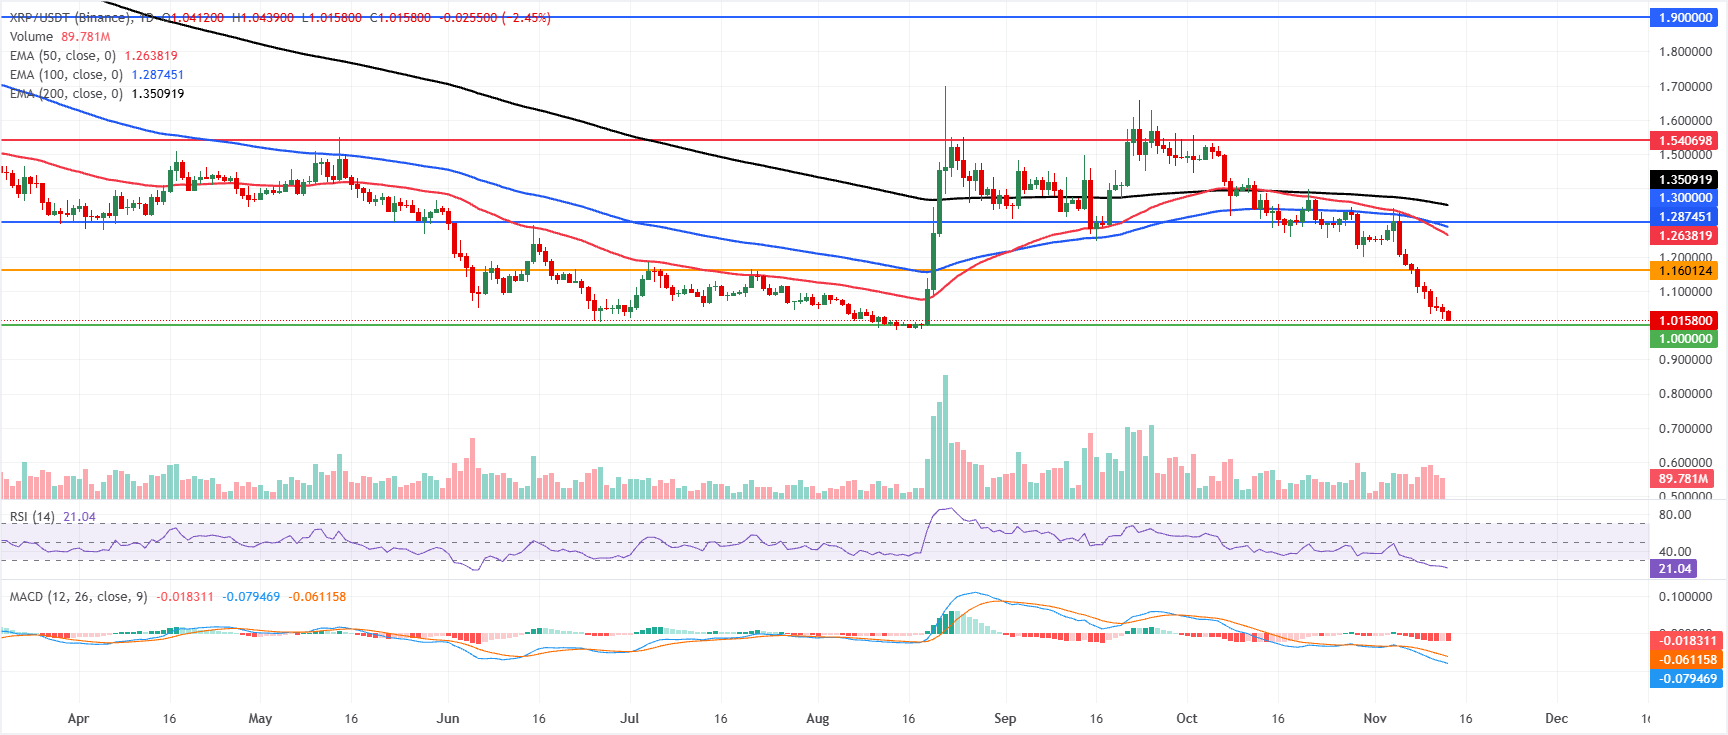
XRP price trades at $1.015 on Friday, extending a bearish near-term bias as it remains firmly below the 50-day, 100-day and 200-day EMAs at $1.263, $1.287 and $1.350 respectively. The MACD stays below zero, while the RSI hovers in oversold territory around 21, suggesting persistent downside pressure even as the sell-off looks stretched.
On the topside, initial resistance emerges at $1.160, ahead of a more notable barrier at $1.300, with the clustered longer-term EMAs around $1.287–$1.350 reinforcing a broader supply zone before the higher resistance at $1.540 and $1.900.
On the downside, immediate support is the horizontal floor at $1.000; a decisive break below this level would expose fresh lows, while holding above it could allow a corrective bounce toward the aforementioned resistance levels.
(The technical analysis of this story was written with the help of an AI tool. Know more.)
Cryptocurrency prices FAQs
Token launches influence demand and adoption among market participants. Listings on crypto exchanges deepen the liquidity for an asset and add new participants to an asset’s network. This is typically bullish for a digital asset.
A hack is an event in which an attacker captures a large volume of the asset from a DeFi bridge or hot wallet of an exchange or any other crypto platform via exploits, bugs or other methods. The exploiter then transfers these tokens out of the exchange platforms to ultimately sell or swap the assets for other cryptocurrencies or stablecoins. Such events often involve an en masse panic triggering a sell-off in the affected assets.
Macroeconomic events like the US Federal Reserve’s decision on interest rates influence crypto assets mainly through the direct impact they have on the US Dollar. An increase in interest rate typically negatively influences Bitcoin and altcoin prices, and vice versa. If the US Dollar index declines, risk assets and associated leverage for trading gets cheaper, in turn driving crypto prices higher.
Halvings are typically considered bullish events as they slash the block reward in half for miners, constricting the supply of the asset. At consistent demand if the supply reduces, the asset’s price climbs.
Nothing in this material constitutes investment advice, personal recommendation, investment research, an offer, or a solicitation to buy or sell any financial instrument. The content has been prepared without consideration of your individual investment objectives, financial situation, or needs, and should not be treated as such.
Past performance is not a reliable indicator of future performance and/or results. Forward-looking scenarios or forecasts are not a guarantee of future performance. Actual results may differ materially from those anticipated.
Mitrade makes no representation or warranty as to the accuracy or completeness of the information provided and accepts no liability for any loss arising from reliance on such information.
Recommended Articles


