



Ripple Price Forecast: XRP upside capped under $1.00 amid subdued retail and institutional demand
- XRP extends consolidation between lower range limit at $0.90 and upper range limit at $1.00.
- XRP recovery faces falling ETF and retail demand, with futures Open Interest at 1.95 billion XRP.
- XRP’s technical outlook supports early recovery stages, with the RSI rising from oversold territory.
Ripple (XRP) is gradually gaining momentum on Thursday, but remains constrained between $0.90 support and the immediate psychological support at $1.00. Although the path of least resistance is largely downward, sustained buy-the-dip activity in the spot market will likely pave the way for an extended recovery.
Sustained XRP capital outflows risk fresh decline
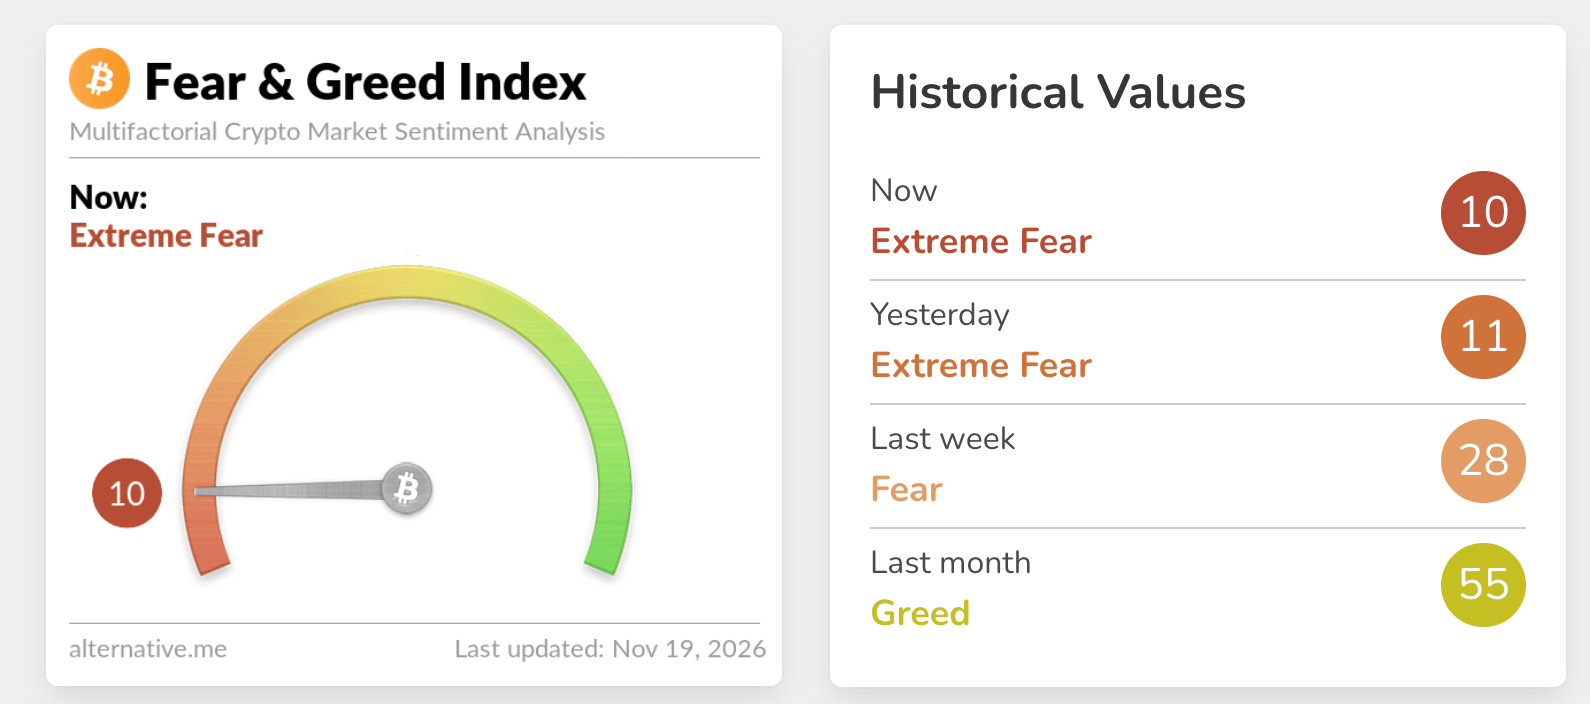
The Fear & Greed Index is at 10 in the Extreme Fear territory on Thursday, down only slightly from 11 in the same range the previous day. Overall, the index has dropped sharply from 55 in the Greed zone last month, undermining risk appetite.
If the crypto market sustains weak sentiment, the path of least resistance would remain firmly downward, capping upside at $1.00 and raising the odds of an extended correction below $0.90. Still, traders should temper their bearish expectations, as extreme fear often coincides with a price turnaround and recovery.
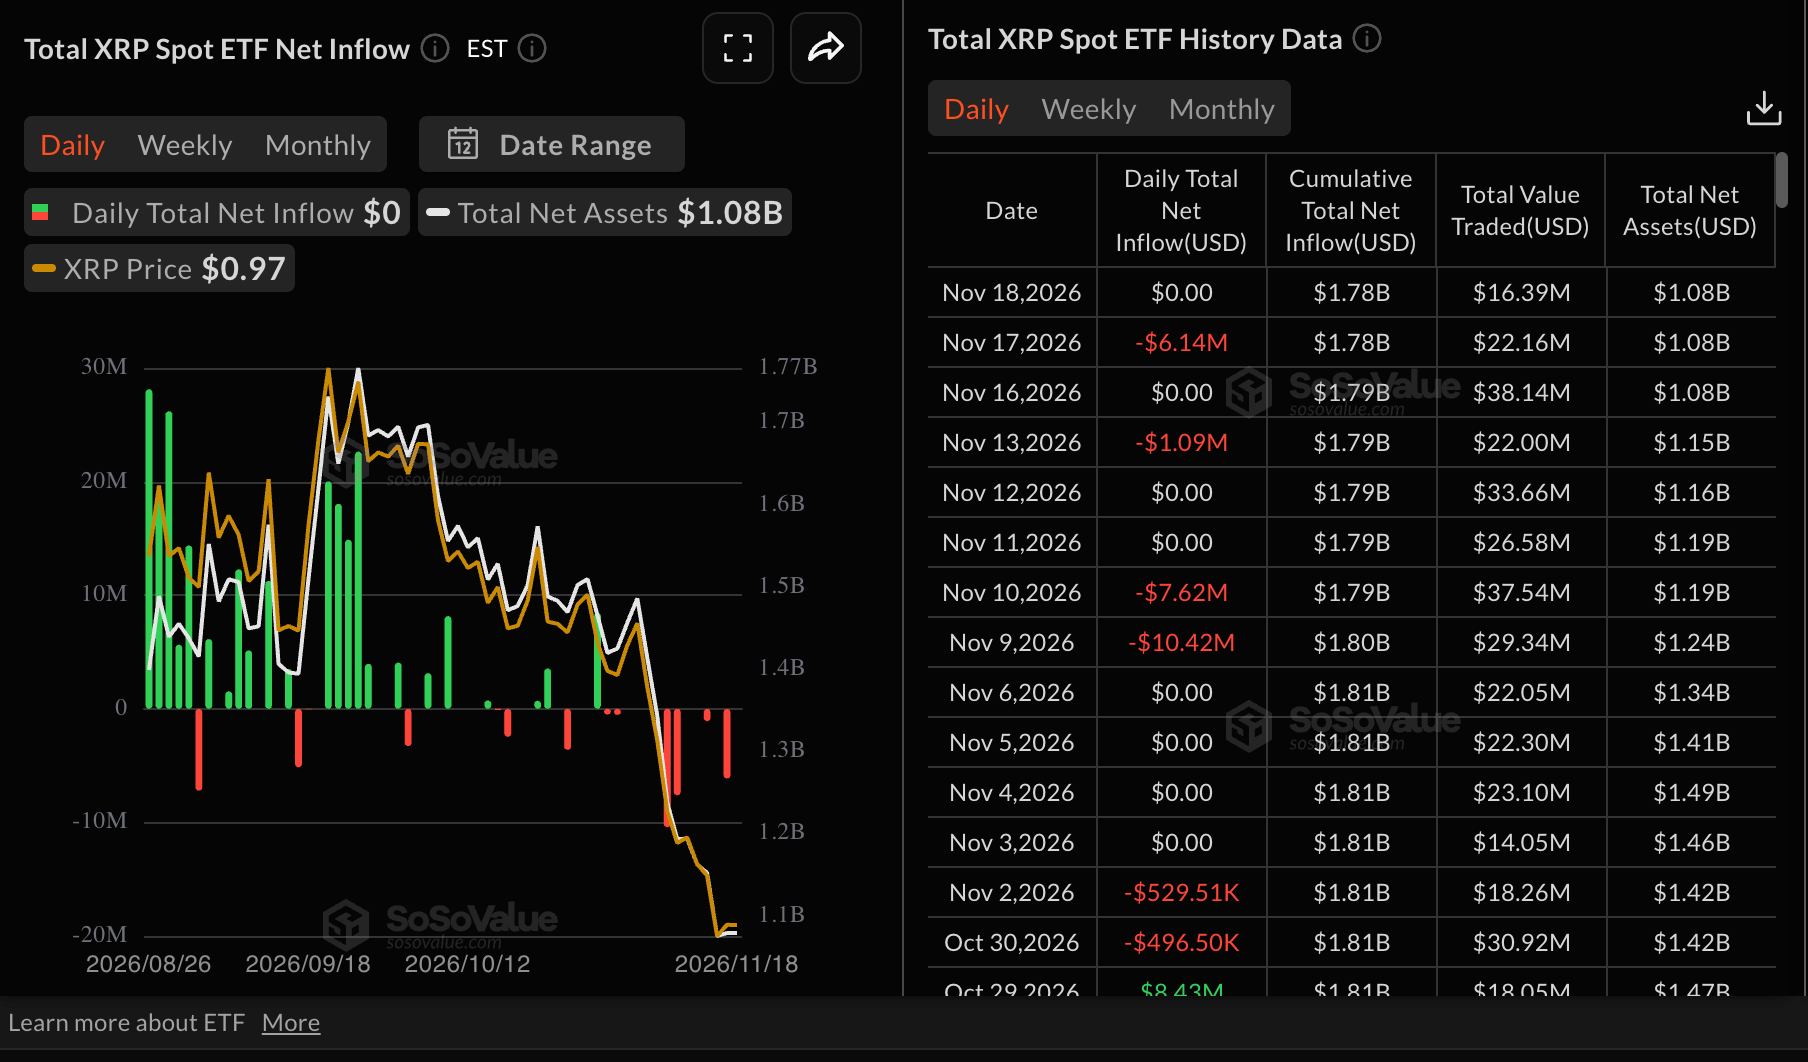
Meanwhile, remained muted on Wednesday, with zero flows. Broadly, the outlook is bearish, given $6 million in outflows the day before and $1 million last Friday. Despite XRP spot ETFs’ first anniversary this month, cumulative inflows average $1.8 billion, with net assets under management at $1.1 billion, suggesting undersubscription compared to Bitcoin (BTC) and Ethereum (ETH).
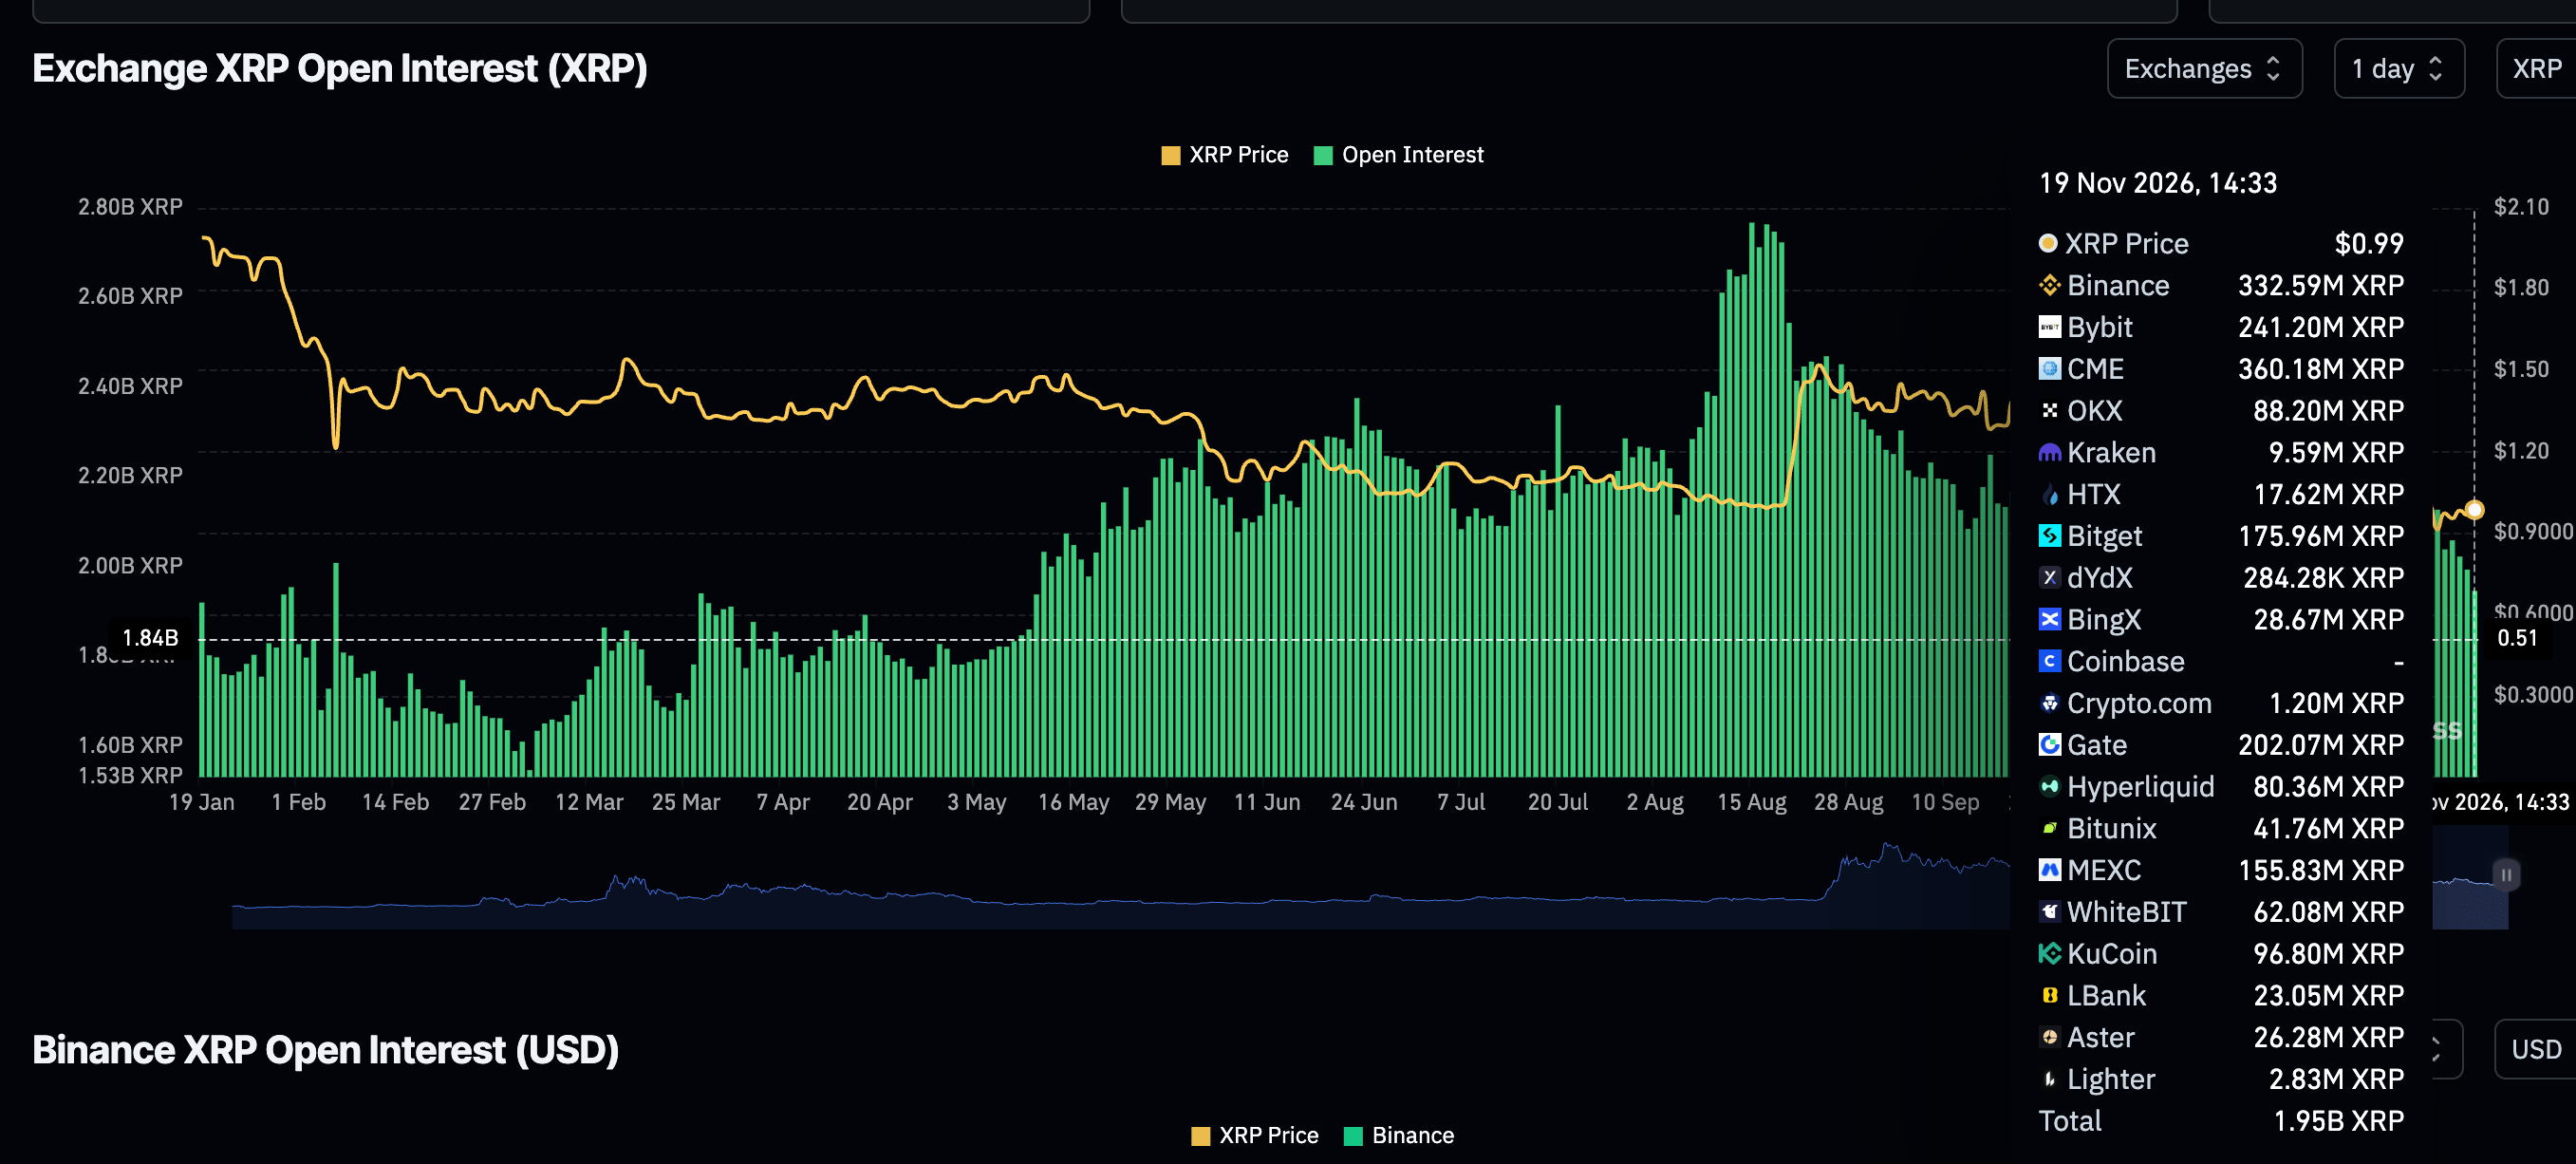
The derivatives market remains weak, as reflected in perpetual futures Open Interest (OI) averaging 1.95 billion XRP on Thursday, down from 2.02 billion XRP the day before. CoinGlass data shows a broader correction from 2.36 billion XRP on November 8 and 2.77 billion farther back in mid-August. Subdued retail demand suggests traders may be deliberately reducing risk exposure or waiting on the sidelines until stability is established before reengaging. This directly impacts demand and lowers recovery potential.
Technical analysis: XRP sustains sideways action
XRP trades around $0.98, extending its decline well below the key Exponential Moving Averages (EMAs), which keeps the near-term bias firmly bearish. The 50-day Exponential Moving Average (EMA) at $1.20, the downward-sloping trendline resistance near $1.22, and the 100-day EMA at $1.25 all sit overhead, suggesting that any rebound would face layered supply before the broader downtrend could ease.
Momentum conditions reinforce this pressured tone, with the Relative Strength Index (RSI) hovering near 32 and the Moving Average Convergence Divergence (MACD) indicator still negative, hinting that sellers retain control despite emerging oversold signals.
Initial resistance lies at the pivotal $1.00, followed by the 50-day EMA around $1.20 and ahead of the descending trendline barrier at $1.22, where prior failures have repeatedly capped recovery attempts. Above that, the 100-day EMA at $1.25 and the more distant 200-day EMA at $1.33 define a broader supply zone that would likely cap any medium-term bounce while price trades below these levels.
With no clear structural support levels highlighted on the daily chart, short-term traders may look to intraday price action and volume spikes to gauge where buyers start to emerge. Still, the technical structure continues to favor rallies being sold into below the clustered moving-average resistance band.
(The technical analysis of this story was written with the help of an AI tool. Know more.)
Open Interest, funding rate FAQs
Higher Open Interest is associated with higher liquidity and new capital inflow to the market. This is considered the equivalent of increase in efficiency and the ongoing trend continues. When Open Interest decreases, it is considered a sign of liquidation in the market, investors are leaving and the overall demand for an asset is on a decline, fueling a bearish sentiment among investors.
Funding fees bridge the difference between spot prices and prices of futures contracts of an asset by increasing liquidation risks faced by traders. A consistently high and positive funding rate implies there is a bullish sentiment among market participants and there is an expectation of a price hike. A consistently negative funding rate for an asset implies a bearish sentiment, indicating that traders expect the cryptocurrency’s price to fall and a bearish trend reversal is likely to occur.
Nothing in this material constitutes investment advice, personal recommendation, investment research, an offer, or a solicitation to buy or sell any financial instrument. The content has been prepared without consideration of your individual investment objectives, financial situation, or needs, and should not be treated as such.
Past performance is not a reliable indicator of future performance and/or results. Forward-looking scenarios or forecasts are not a guarantee of future performance. Actual results may differ materially from those anticipated.
Mitrade makes no representation or warranty as to the accuracy or completeness of the information provided and accepts no liability for any loss arising from reliance on such information.
Recommended Articles


