

Dow Jones Industrial Average shrugs off hot PPI and an island shopping list
- DJIA clawed back part of Wednesday's selloff before fading on hot inflation data and fresh Iran escalation.
- Headline PPI accelerated past consensus while the core measure missed and jobless claims rose.
- Threats to seize Kharg Island keep the energy passthrough alive days before the Fed's June meeting.
After Wednesday's near 2% drubbing, the Dow Jones Industrial Average (DJIA) spent Thursday doing something stranger than falling: very little. A 6.5% YoY Producer Price Index (PPI) print, rising jobless claims, and a President promising to seize Iran's main oil terminal added up to a close only fractionally lower, which says plenty about how numb this tape has become.
The session was anything but calm, with an early dip below the 50,000 handle bought hard and the index running to the 50,350 area through the European morning. The 12:30 GMT data dump knocked it back toward 50,100, and a New York-open spike just shy of 50,400 was sold within minutes, leaving the Dow near 50,200 at the close.
An inflation report built for arguments
The headline numbers were ugly: producer prices rose 1.1% MoM for a second straight month, lifting the annual rate to 6.5% against a 6.4% consensus and 5.7% prior. The core gauge told a different story, adding 0.4% MoM against 0.5% expected and holding at 4.9% YoY when forecasters looked for 5.4%. Initial claims rose to 229K versus 219K expected.
Bulls are leaning on the core miss as proof that underlying disinflation survived the war, which is a thin branch one day after the Consumer Price Index (CPI) printed 4.2% YoY, its fastest pace in three years. When energy is the entire inflation problem, and the energy shock is a function of a war the White House keeps promising to widen, stripping it out is accounting rather than analysis. Add creeping claims and the mix smells distinctly stagflationary.
Kharg Island enters the chat
The President spent Thursday morning pledging that the US military would hit Iran very hard overnight and would, in due course, take Kharg Island and other oil infrastructure, with Venezuela invoked as the template. Reporting citing administration sources describes frustration that this week's strikes are not being read as forceful enough. Kharg handled roughly 90% of Iran's Crude Oil exports before the war, so the threat targets the regime's last revenue artery.
The market filed it under posture, and not without reason; within hours the same President told an interviewer he was unsure America had the stomach for the operation, and Crude Oil futures eased toward $89. With the Navy already blockading Iranian ports and the Strait of Hormuz largely shut, seizing the island adds occupation risk without reopening the chokepoint that matters. The PPI is the standing counterargument: posture or not, the energy damage is already in the data.
New chair, hot data, no easy answers
Rate futures price next week's Federal Open Market Committee (FOMC) decision as a near-certain hold, and the live debate has quietly inverted; markets now entertain a hike later this year rather than a cut. The June 16 to 17 meeting delivers a fresh dot plot and the first decision under new Federal Reserve (Fed) Chair Kevin Warsh, who inherits 4.2% CPI, 6.5% PPI and a war premium no model handles cleanly. Equities choosing the dovish core-miss read over the hawkish headline is a choice, not a verdict.
Friday preview: Michigan and the expectations problem
Friday's calendar centers on the preliminary June University of Michigan (UoM) survey at 14:00 GMT, where consensus sees headline sentiment near 46 from 44.8 and the expectations index around 44.3. Those are recession-grade levels of gloom, so the inflation lines matter more than the direction.
The 1-year inflation expectations measure enters at 4.8% and the 5-year at 3.9%, and with pump prices chasing the war higher, the risk sits to the upside. A 5-handle on the 1-year reading, four days before the FOMC, would feed the hike chatter directly. Friday also hosts the largest stock market debut on record.
The levels that matter
Resistance: Sellers capped the morning advance around 50,350 on repeated attempts, and the cash-open spike to just shy of 50,400 lasted minutes. Bulls have no real claim until the index closes above that rejected high.
Support: Dip buyers defended the 50,100 area through the afternoon. Below that sits the 50,000 handle, with Thursday's early low printed just under 49,950; a daily close back beneath the round figure would turn this stabilization into a one-day wonder.
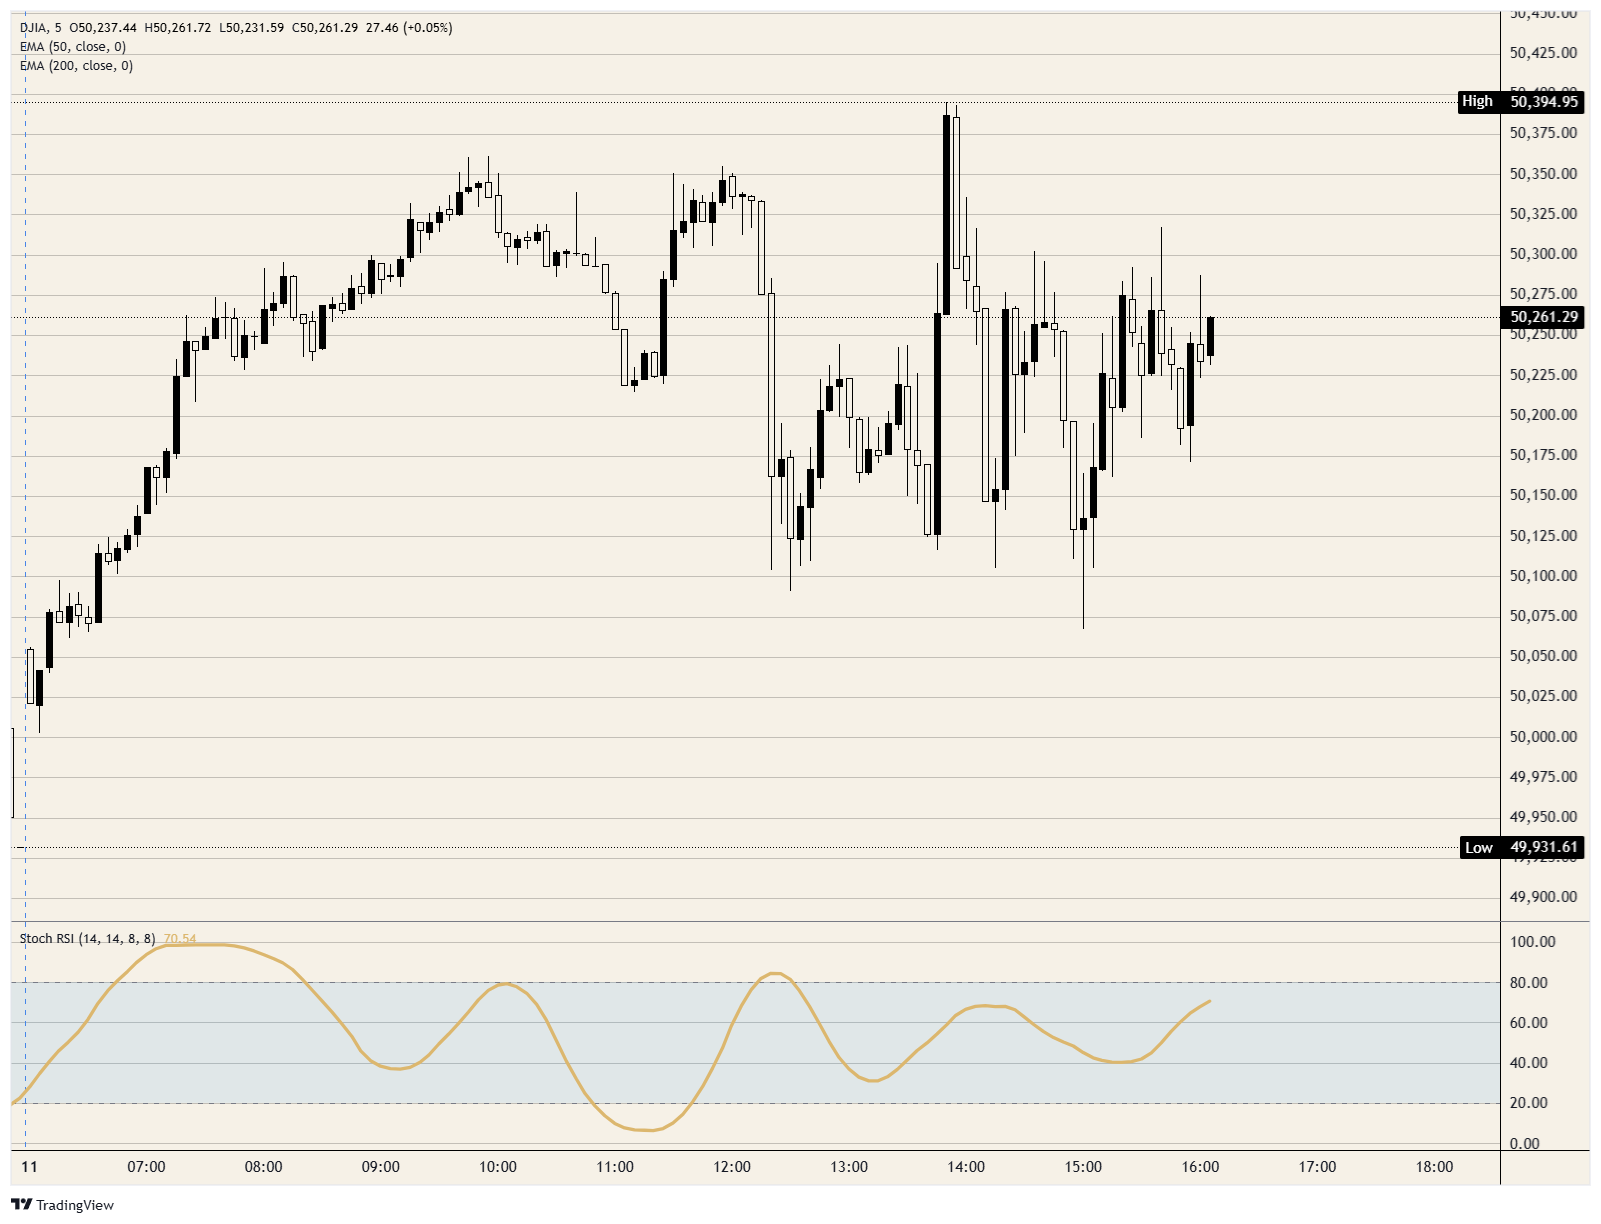
Bias: Neutral with a defensive lean. Intraday momentum on the Stochastic Relative Strength Index (Stoch RSI) is mid-range and rising into the close, enough for another probe higher, but the index remains boxed between roughly 50,100 and 50,350 while promised overnight strikes, Friday's inflation expectations data and a record listing all argue for more volatility rather than less.
Dow Jones 5-minute chart
Dow Jones FAQs
The Dow Jones Industrial Average, one of the oldest stock market indices in the world, is compiled of the 30 most traded stocks in the US. The index is price-weighted rather than weighted by capitalization. It is calculated by summing the prices of the constituent stocks and dividing them by a factor, currently 0.152. The index was founded by Charles Dow, who also founded the Wall Street Journal. In later years it has been criticized for not being broadly representative enough because it only tracks 30 conglomerates, unlike broader indices such as the S&P 500.
Many different factors drive the Dow Jones Industrial Average (DJIA). The aggregate performance of the component companies revealed in quarterly company earnings reports is the main one. US and global macroeconomic data also contributes as it impacts on investor sentiment. The level of interest rates, set by the Federal Reserve (Fed), also influences the DJIA as it affects the cost of credit, on which many corporations are heavily reliant. Therefore, inflation can be a major driver as well as other metrics which impact the Fed decisions.
Dow Theory is a method for identifying the primary trend of the stock market developed by Charles Dow. A key step is to compare the direction of the Dow Jones Industrial Average (DJIA) and the Dow Jones Transportation Average (DJTA) and only follow trends where both are moving in the same direction. Volume is a confirmatory criteria. The theory uses elements of peak and trough analysis. Dow’s theory posits three trend phases: accumulation, when smart money starts buying or selling; public participation, when the wider public joins in; and distribution, when the smart money exits.
There are a number of ways to trade the DJIA. One is to use ETFs which allow investors to trade the DJIA as a single security, rather than having to buy shares in all 30 constituent companies. A leading example is the SPDR Dow Jones Industrial Average ETF (DIA). DJIA futures contracts enable traders to speculate on the future value of the index and Options provide the right, but not the obligation, to buy or sell the index at a predetermined price in the future. Mutual funds enable investors to buy a share of a diversified portfolio of DJIA stocks thus providing exposure to the overall index.
Nothing in this material constitutes investment advice, personal recommendation, investment research, an offer, or a solicitation to buy or sell any financial instrument. The content has been prepared without consideration of your individual investment objectives, financial situation, or needs, and should not be treated as such.
Past performance is not a reliable indicator of future performance and/or results. Forward-looking scenarios or forecasts are not a guarantee of future performance. Actual results may differ materially from those anticipated.
Mitrade makes no representation or warranty as to the accuracy or completeness of the information provided and accepts no liability for any loss arising from reliance on such information.
Recommended Articles


