CFDs are complex instruments and come with a high risk of losing money rapidly due to leverage. 74% of retail investor accounts lose money when trading CFDs with this provider. You should consider whether you understand how CFDs work and whether you can afford to take the high risk of losing your money.

Shiba Inu Price Analysis: Bearish trend persists as sentiment remains mixed

Source Fxstreet
  • Shiba Inu price steadies on Wednesday, facing resistance at the previously broken weekly level at $0.0000068.
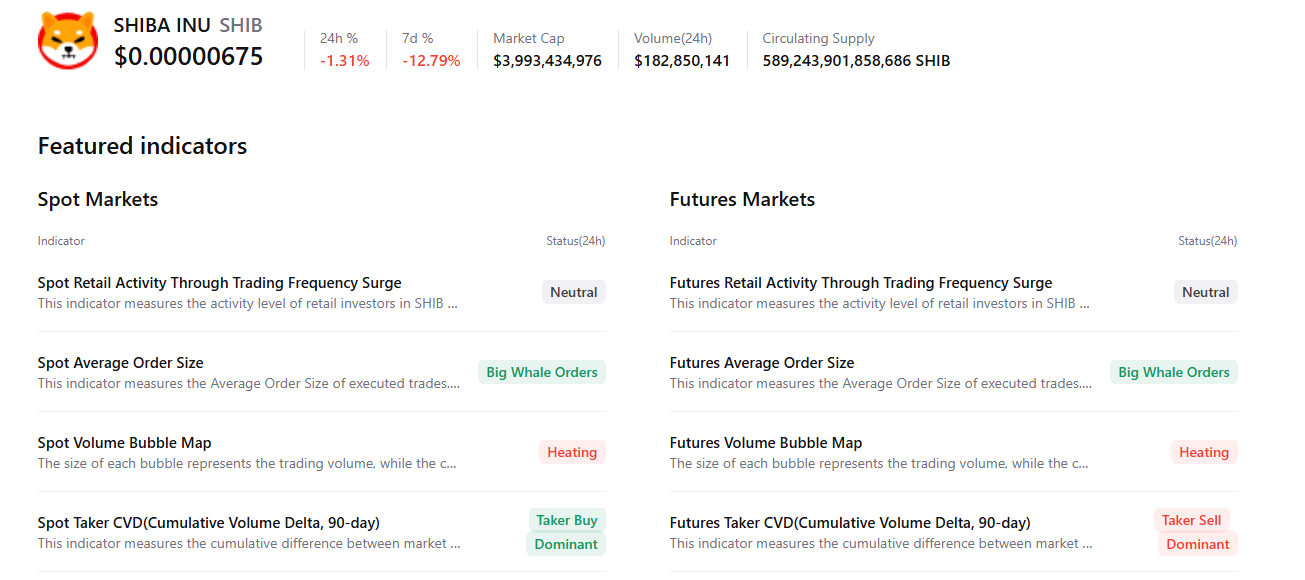
  • On-chain data shows mixed sentiment, with increased large orders offset by overheating conditions and growing sell-side dominance.
  • Traders should be cautious, as any short-term relief rally appears fragile, as the primary trend remains bearish.

Shiba Inu (SHIB) price stabilizes at $0.0000067 at the time of writing on Wednesday, facing rejection around a key resistance zone. On-chain and derivatives data indicate mixed sentiment among traders, further limiting the chances of a price recovery.

Mixed sentiment among traders caps SHIB’s recovery

CryptoQuant’s summary data suggests that the dog-themed meme coin sentiment among traders is mixed. While there are large whale orders in both the spot and futures markets, suggesting bullish interest, overheating conditions and rising sell-side dominance indicate that selling pressure remains elevated. This combination suggests indecision among meme coin investors and limits the chances of a sustained recovery.

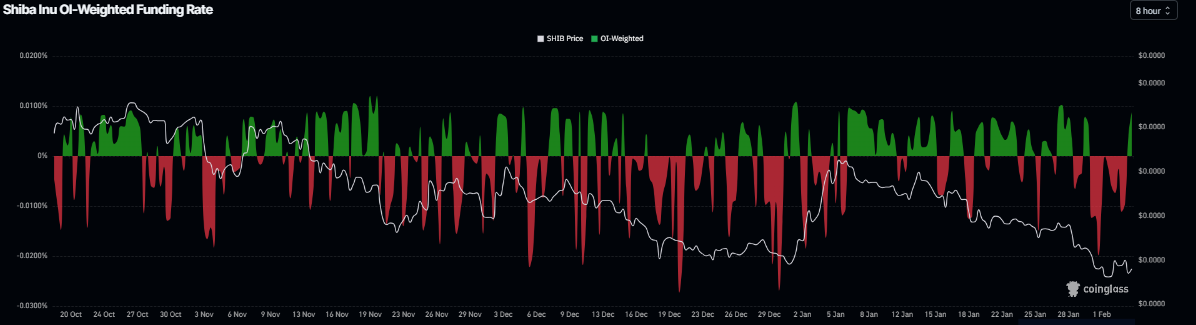
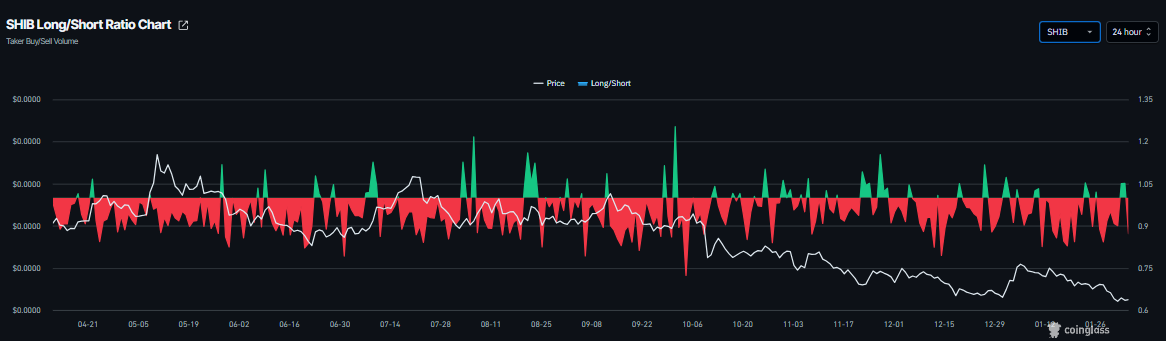
Similarly, the derivatives market is cautious. CoinGlass data shows SHIB’s funding rate flipped positive on Wednesday, currently at 0.0088%, indicating that long positions are paying shorts and hinting at bullish sentiment. However, the long-to-short ratio has slipped to 0.87 on the same period, signaling a rise in short bets. This divergence highlights growing uncertainty in the derivatives market and weakens bullish conviction.

SHIB funding rate chart. Source: Coinglass
SHIB long-to-short ratio chart. Source: Coinglass

Shiba Inu Price Forecast: SHIB extends losses below October 10 flash-crash low

Shiba Inu price corrected over 11% last week, slipping below the October 10 flash-crash low of $0.0000067 and reaching a level not seen since mid-June 2023. SHIB also closed below the weekly resistance at $0.0000068 and has faced resistance around this level. As of writing on Wednesday, the meme coin is trading at $0.0000067.

If SHIB continues its downward trend, it could extend the correction toward Saturday’s low of $0.0000061. A close below this level could extend the further losses toward the June 10, 2023, low of $0.0000054.

The Relative Strength Index (RSI) is at 35 on the daily chart, recovering slightly above oversold levels, hinting at a potential short-term bounce, though downside risks remain. The Moving Average Convergence Divergence (MACD) indicator showed a bearish crossover on January 17, which remains intact and thus further supports the negative outlook.

SHIB/USDT daily chart

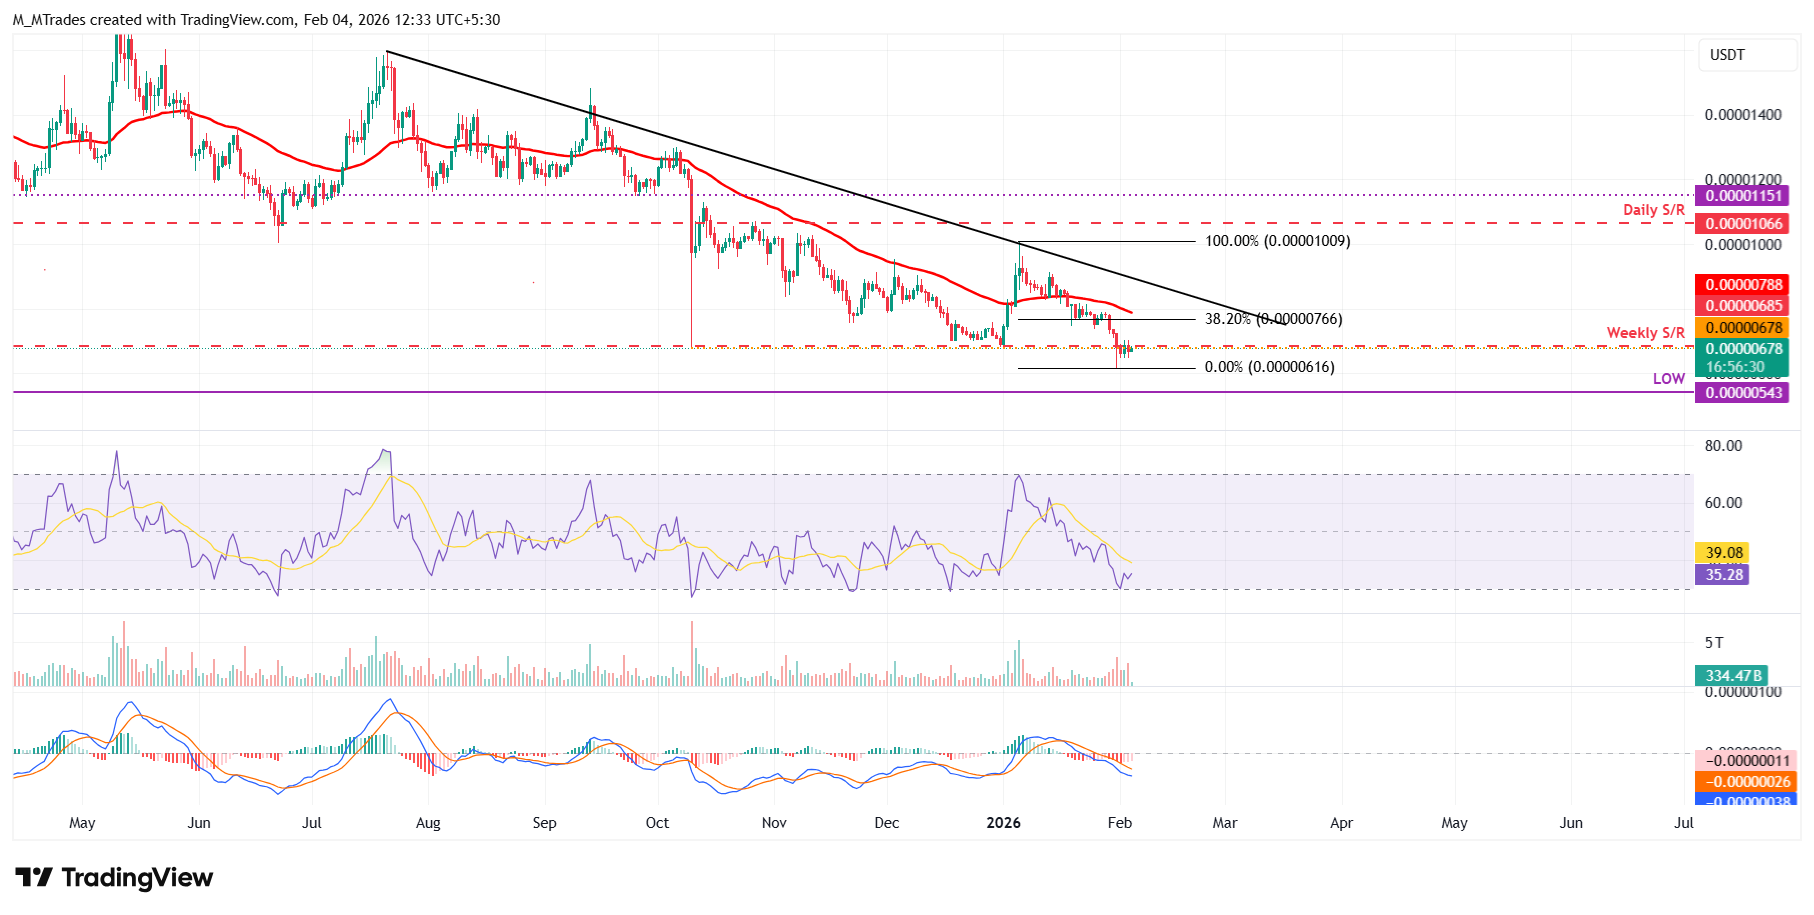
Traders should remain cautious as the primary trend for SHIB remains bearish, so any short-term recovery has a high probability of a dead-cat bounce — a brief price increase within a broader downtrend. 

If SHIB recovers, it could extend the advance toward the 50-day Exponential Moving Average (EMA) at $0.0000078.

Disclaimer: The content available on Mitrade Insights is provided for informational and marketing purposes only. It has not been prepared in accordance with legal requirements designed to promote the independence of investment research and is not subject to any prohibition on dealing ahead of the dissemination of investment research
Nothing in this material constitutes investment advice, personal recommendation, investment research, an offer, or a solicitation to buy or sell any financial instrument. The content has been prepared without consideration of your individual investment objectives, financial situation, or needs, and should not be treated as such.
Past performance is not a reliable indicator of future performance and/or results. Forward-looking scenarios or forecasts are not a guarantee of future performance. Actual results may differ materially from those anticipated.
Mitrade makes no representation or warranty as to the accuracy or completeness of the information provided and accepts no liability for any loss arising from reliance on such information.
placeholder
Pi Network Price Annual Forecast: PI set for rocky 2026 as community eyes real-world utilityPi Network (PI) crashed by over 90% in 2025 from its all-time high of $3.00, with minor recovery along the way. The downfall was fueled by low investor confidence as mainnet migrations increased token deposits on Know Your Business (KYB) verified exchanges. 
Author  FXStreet
Dec 19, 2025
Pi Network (PI) crashed by over 90% in 2025 from its all-time high of $3.00, with minor recovery along the way. The downfall was fueled by low investor confidence as mainnet migrations increased token deposits on Know Your Business (KYB) verified exchanges. 
placeholder
Pi Network Price Forecast: PI rebounds slightly but selling pressure persistsPi Network (PI) edges higher by 1% at press time on Tuesday, signaling a minor recovery after recording a fresh record low of $0.1502 on Monday. Mainnet holders have withdrawn over 4 million PI tokens from centralized exchanges supporting Pi Network over the last 24 hours.
Author  FXStreet
Jan 20, Tue
Pi Network (PI) edges higher by 1% at press time on Tuesday, signaling a minor recovery after recording a fresh record low of $0.1502 on Monday. Mainnet holders have withdrawn over 4 million PI tokens from centralized exchanges supporting Pi Network over the last 24 hours.
placeholder
Zcash Price Forecast: ZEC bears eye levels below $300 as bearish momentum buildsZcash (ZEC) price is trading below $365 on Tuesday, after closing below the key support zone the previous day. The bearish narrative for ZEC strengthens as metrics show sell-side dominance rising and funding rates turning negative.
Author  FXStreet
Jan 20, Tue
Zcash (ZEC) price is trading below $365 on Tuesday, after closing below the key support zone the previous day. The bearish narrative for ZEC strengthens as metrics show sell-side dominance rising and funding rates turning negative.
placeholder
Gold stocks lead sell-off in Australian shares ahead of central bank meetingAXJO closes down 1% in worst day in two monthsGold miners down 7.2%, worst day since late OctoberRBA expected to hike interest rate - Reuters pollBy Shruti Agarwal Feb 2 (Reuters) - Australian shares clocked their steepest losses in two months on Monday, weighed down by precious and base metal m...
Author  Reuters
Feb 02, Mon
AXJO closes down 1% in worst day in two monthsGold miners down 7.2%, worst day since late OctoberRBA expected to hike interest rate - Reuters pollBy Shruti Agarwal Feb 2 (Reuters) - Australian shares clocked their steepest losses in two months on Monday, weighed down by precious and base metal m...
placeholder
Silver Price Forecasts: XAG/USD rises beyond $87.00 after a two-day selloffSilver (XAG/USD) shows moderate gains on Tuesday, trading at $87.05 at the time of writing. The white metal found some footing after plummeting more than 30% in the previous two trading days, hitting one-month lows right below the $72.00 line.
Author  FXStreet
Yesterday 08: 54
Silver (XAG/USD) shows moderate gains on Tuesday, trading at $87.05 at the time of writing. The white metal found some footing after plummeting more than 30% in the previous two trading days, hitting one-month lows right below the $72.00 line.
goTop
quote