

USD/JPY Price Forecast: Stalls near intervention area as bulls eye 160.00
- USD/JPY extends seven-day rally but stalls near intervention zone.
- RSI remains bullish, signaling upside momentum despite 160.00 intervention fears.
- Break above 159.52 exposes 160.00 and 160.72 resistance levels.
USD/JPY rally extends for the seventh straight day, up 0.10% to a 12-day high of 159.25, despite growing fears of Japanese authorities intervening in FX markets. At the time of writing, the pair trades near 159.00.
USD/JPY Price Forecast: Technical outlook
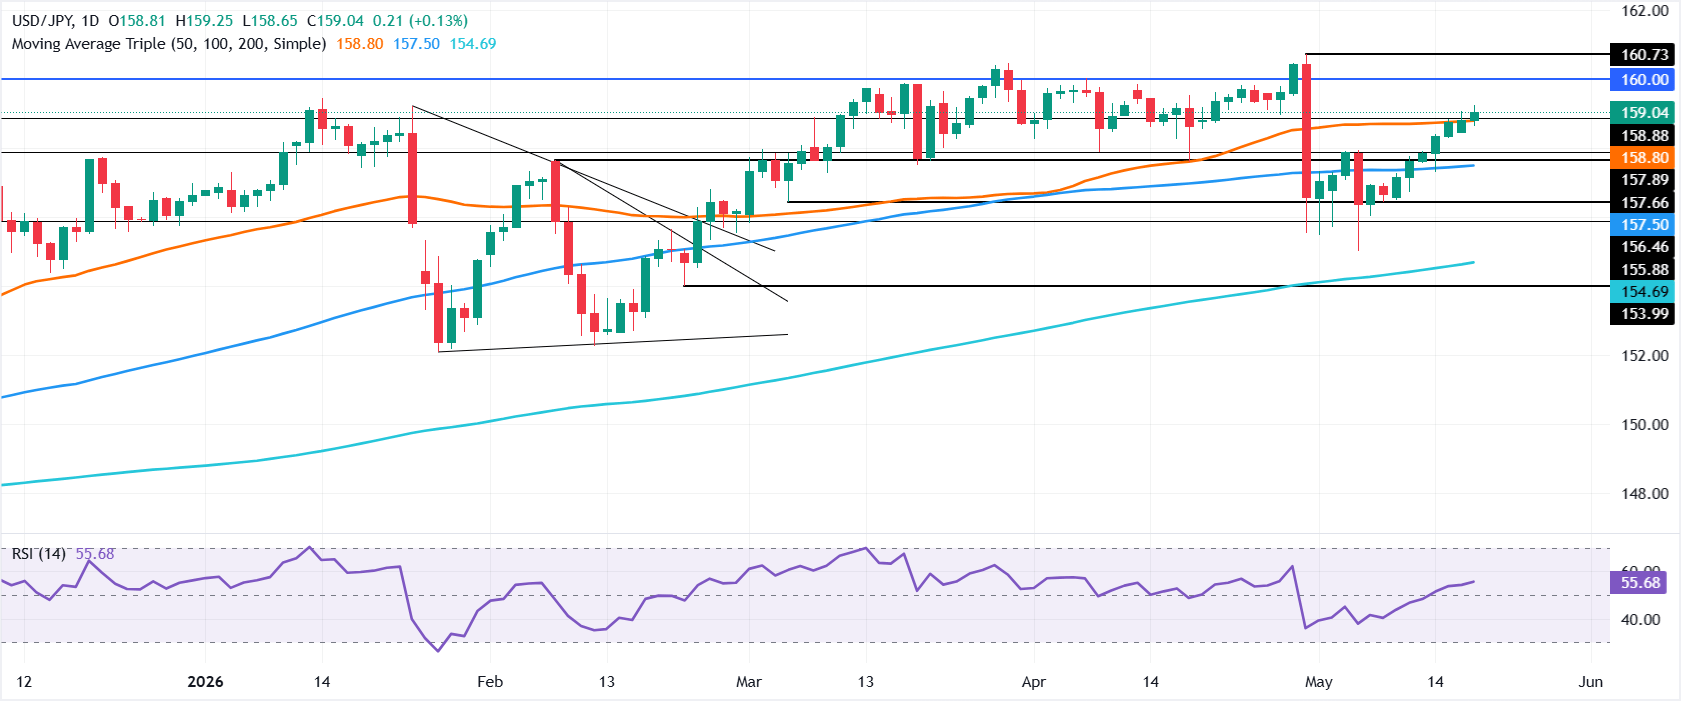
Despite recovering, USD/JPY is poised to consolidate, capped by the line in the sand “intervention zone” around 159.00-160.00, which opens the door for sellers to step in and push the pair lower.
Momentum is bullish as depicted by the Relative Strength Index (RSI) an indication that further upside is seen.
If USD/JPY clears the April 29 daily low-turned-resistance at 159.52, traders can challenge the 160.00 mark. On further strength, the next resistance is the yearly high at 160.72.
Conversely, if USD/JPY slides past the 159.00 mark, it clears the path to the next area of interest, being the 50-day SMA at 158.80, followed by the 20-day SMA at 158.23. If those levels are taken out, the next stop would be 158.00, followed by the 100-day SMA at 157.49.
USD/JPY Price Chart – Daily
Japanese Yen Price Today
The table below shows the percentage change of Japanese Yen (JPY) against listed major currencies today. Japanese Yen was the strongest against the Australian Dollar.
| USD | EUR | GBP | JPY | CAD | AUD | NZD | CHF | |
|---|---|---|---|---|---|---|---|---|
| USD | 0.45% | 0.25% | 0.13% | 0.09% | 0.85% | 0.66% | 0.59% | |
| EUR | -0.45% | -0.19% | -0.30% | -0.36% | 0.41% | 0.22% | 0.14% | |
| GBP | -0.25% | 0.19% | -0.11% | -0.16% | 0.60% | 0.42% | 0.34% | |
| JPY | -0.13% | 0.30% | 0.11% | -0.06% | 0.71% | 0.55% | 0.45% | |
| CAD | -0.09% | 0.36% | 0.16% | 0.06% | 0.77% | 0.59% | 0.51% | |
| AUD | -0.85% | -0.41% | -0.60% | -0.71% | -0.77% | -0.17% | -0.26% | |
| NZD | -0.66% | -0.22% | -0.42% | -0.55% | -0.59% | 0.17% | -0.09% | |
| CHF | -0.59% | -0.14% | -0.34% | -0.45% | -0.51% | 0.26% | 0.09% |
The heat map shows percentage changes of major currencies against each other. The base currency is picked from the left column, while the quote currency is picked from the top row. For example, if you pick the Japanese Yen from the left column and move along the horizontal line to the US Dollar, the percentage change displayed in the box will represent JPY (base)/USD (quote).
Nothing in this material constitutes investment advice, personal recommendation, investment research, an offer, or a solicitation to buy or sell any financial instrument. The content has been prepared without consideration of your individual investment objectives, financial situation, or needs, and should not be treated as such.
Past performance is not a reliable indicator of future performance and/or results. Forward-looking scenarios or forecasts are not a guarantee of future performance. Actual results may differ materially from those anticipated.
Mitrade makes no representation or warranty as to the accuracy or completeness of the information provided and accepts no liability for any loss arising from reliance on such information.
Recommended Articles


