

USD/JPY Price Forecast: Reclaims 160 as RSI nears overbought, BoJ risk looms
- USD/JPY holds intervention zone after recovering April 30 losses.
- RSI near 64 signals bullish momentum approaching overbought conditions.
- Break below 160 exposes 159.50 and 50-day SMA support.
The USD/JPY extends its gains for the second straight day, drifting higher above the 160.00 threshold, in an intervention zone. Still, it remains shy of the year-to-date (YTD) high of 160.72 set on April 30, the same day the pair plunged nearly 500 pips amid the BoJ's market intervention.
USD/JPY Price Forecast: Technical outlook
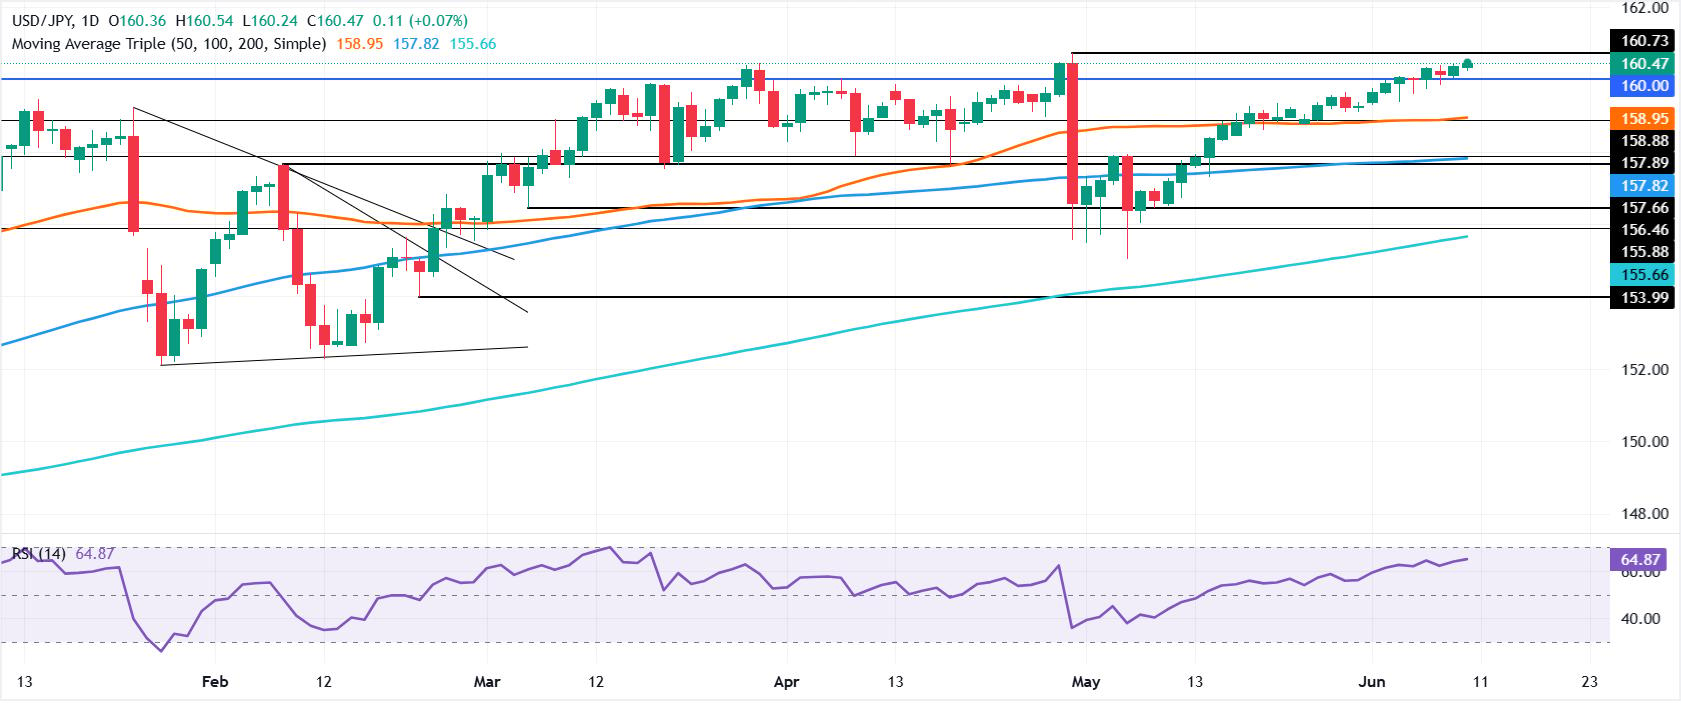
The USD/JPY recovered April’s 30 losses in 28 trading days, and despite momentum remaining bullish—as depicted by the Relative Strength Index (RSI)—, fears that Japanese authorities could step in to push the pair lower are keeping buyers from testing the YTD high of 160.72, ahead of the 161.00 mark.
The RSI is bullish at 64, approaching overbought conditions, though its advance has been steady, an indication of traders' caution.
On the downside, if USD/JPY drops below 160.00, the first support would be 159.50, followed by the June 3 low at 159.36. Below these levels, the next support would be the 50-day Simple Moving Average (SMA) at 158.95, followed by the 100-day SMA at 157.82.
USD/JPY Price Chart – Daily
Japanese Yen Price Today
The table below shows the percentage change of Japanese Yen (JPY) against listed major currencies today. Japanese Yen was the strongest against the Australian Dollar.
| USD | EUR | GBP | JPY | CAD | AUD | NZD | CHF | |
|---|---|---|---|---|---|---|---|---|
| USD | -0.08% | -0.02% | 0.05% | -0.12% | 0.23% | 0.07% | 0.11% | |
| EUR | 0.08% | 0.04% | 0.13% | -0.08% | 0.25% | 0.14% | 0.19% | |
| GBP | 0.02% | -0.04% | 0.06% | -0.10% | 0.24% | 0.11% | 0.14% | |
| JPY | -0.05% | -0.13% | -0.06% | -0.19% | 0.14% | 0.00% | 0.03% | |
| CAD | 0.12% | 0.08% | 0.10% | 0.19% | 0.33% | 0.19% | 0.22% | |
| AUD | -0.23% | -0.25% | -0.24% | -0.14% | -0.33% | -0.14% | -0.10% | |
| NZD | -0.07% | -0.14% | -0.11% | -0.00% | -0.19% | 0.14% | 0.03% | |
| CHF | -0.11% | -0.19% | -0.14% | -0.03% | -0.22% | 0.10% | -0.03% |
The heat map shows percentage changes of major currencies against each other. The base currency is picked from the left column, while the quote currency is picked from the top row. For example, if you pick the Japanese Yen from the left column and move along the horizontal line to the US Dollar, the percentage change displayed in the box will represent JPY (base)/USD (quote).
Nothing in this material constitutes investment advice, personal recommendation, investment research, an offer, or a solicitation to buy or sell any financial instrument. The content has been prepared without consideration of your individual investment objectives, financial situation, or needs, and should not be treated as such.
Past performance is not a reliable indicator of future performance and/or results. Forward-looking scenarios or forecasts are not a guarantee of future performance. Actual results may differ materially from those anticipated.
Mitrade makes no representation or warranty as to the accuracy or completeness of the information provided and accepts no liability for any loss arising from reliance on such information.
Recommended Articles


