



Ripple Price Forecast: XRP bulls gather recovery momentum amid returning ETF inflows
- XRP rebounds above $1.40 from weekly lows of $1.32, as bullish investors actively defend key support at the 100-day and 200-day EMAs.
- XRP spot ETFs recorded $8 million in ETF inflows on Thursday, signaling fresh institutional support.
- XRP risks deeper losses amid a weakening technical structure, with the RSI in bearish territory and a MACD sell signal.
Ripple (XRP) trades largely in bearish hands on Friday near $1.40. Although the remittance token has stabilized after a sharp sell-off from weekly highs of $1.53 to lows around $1.32, the path of least resistance remains downward, unless buyers affirm a daily close above the pivotal $1.40 level.
The prevailing technical outlook appears bearish in the short term but neutral to bullish in the medium term. Support remains relatively firm but sustained gains would require support across the board, from retail traders to institutional investors.
XRP attracts fresh capital inflows
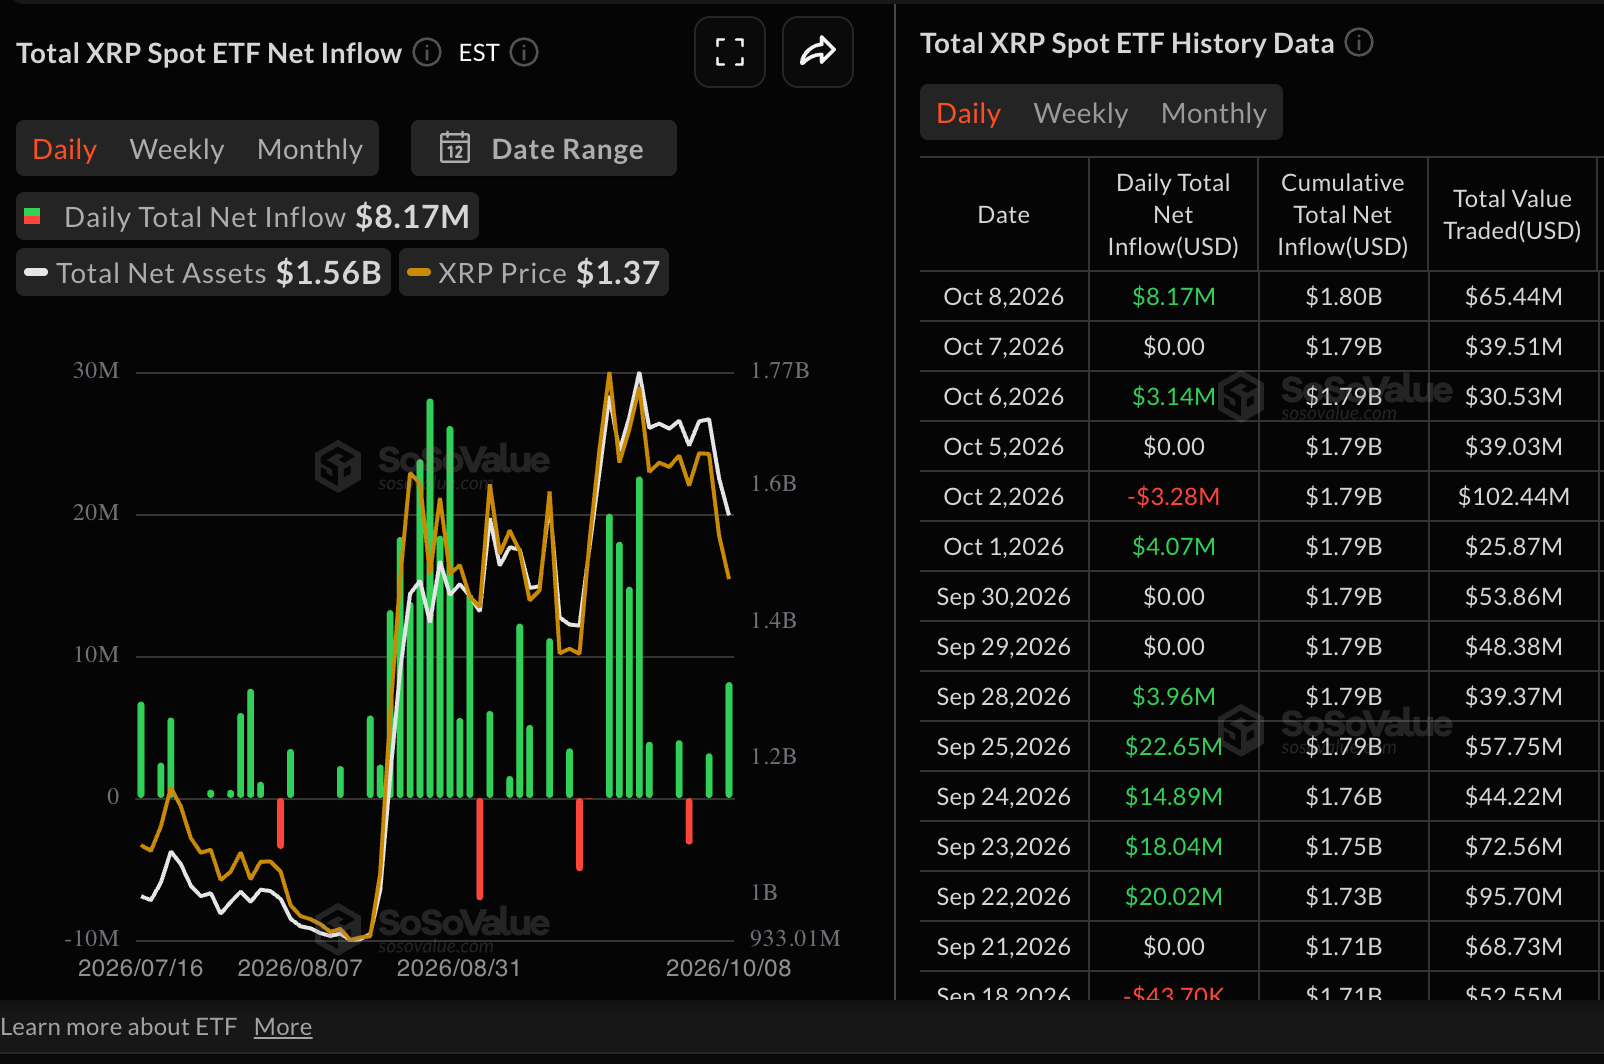
US-listed XRP spot Exchange-Traded Funds (ETFs) recorded $8 million in inflows on Thursday, drying headwinds in the broader crypto market. The token has $1.8 billion in cumulative inflows and $1.6 billion in net assets under management, according to SoSoValue. This underpins returning institutional support amid more volatile flows, helping cushion against prevailing losses.
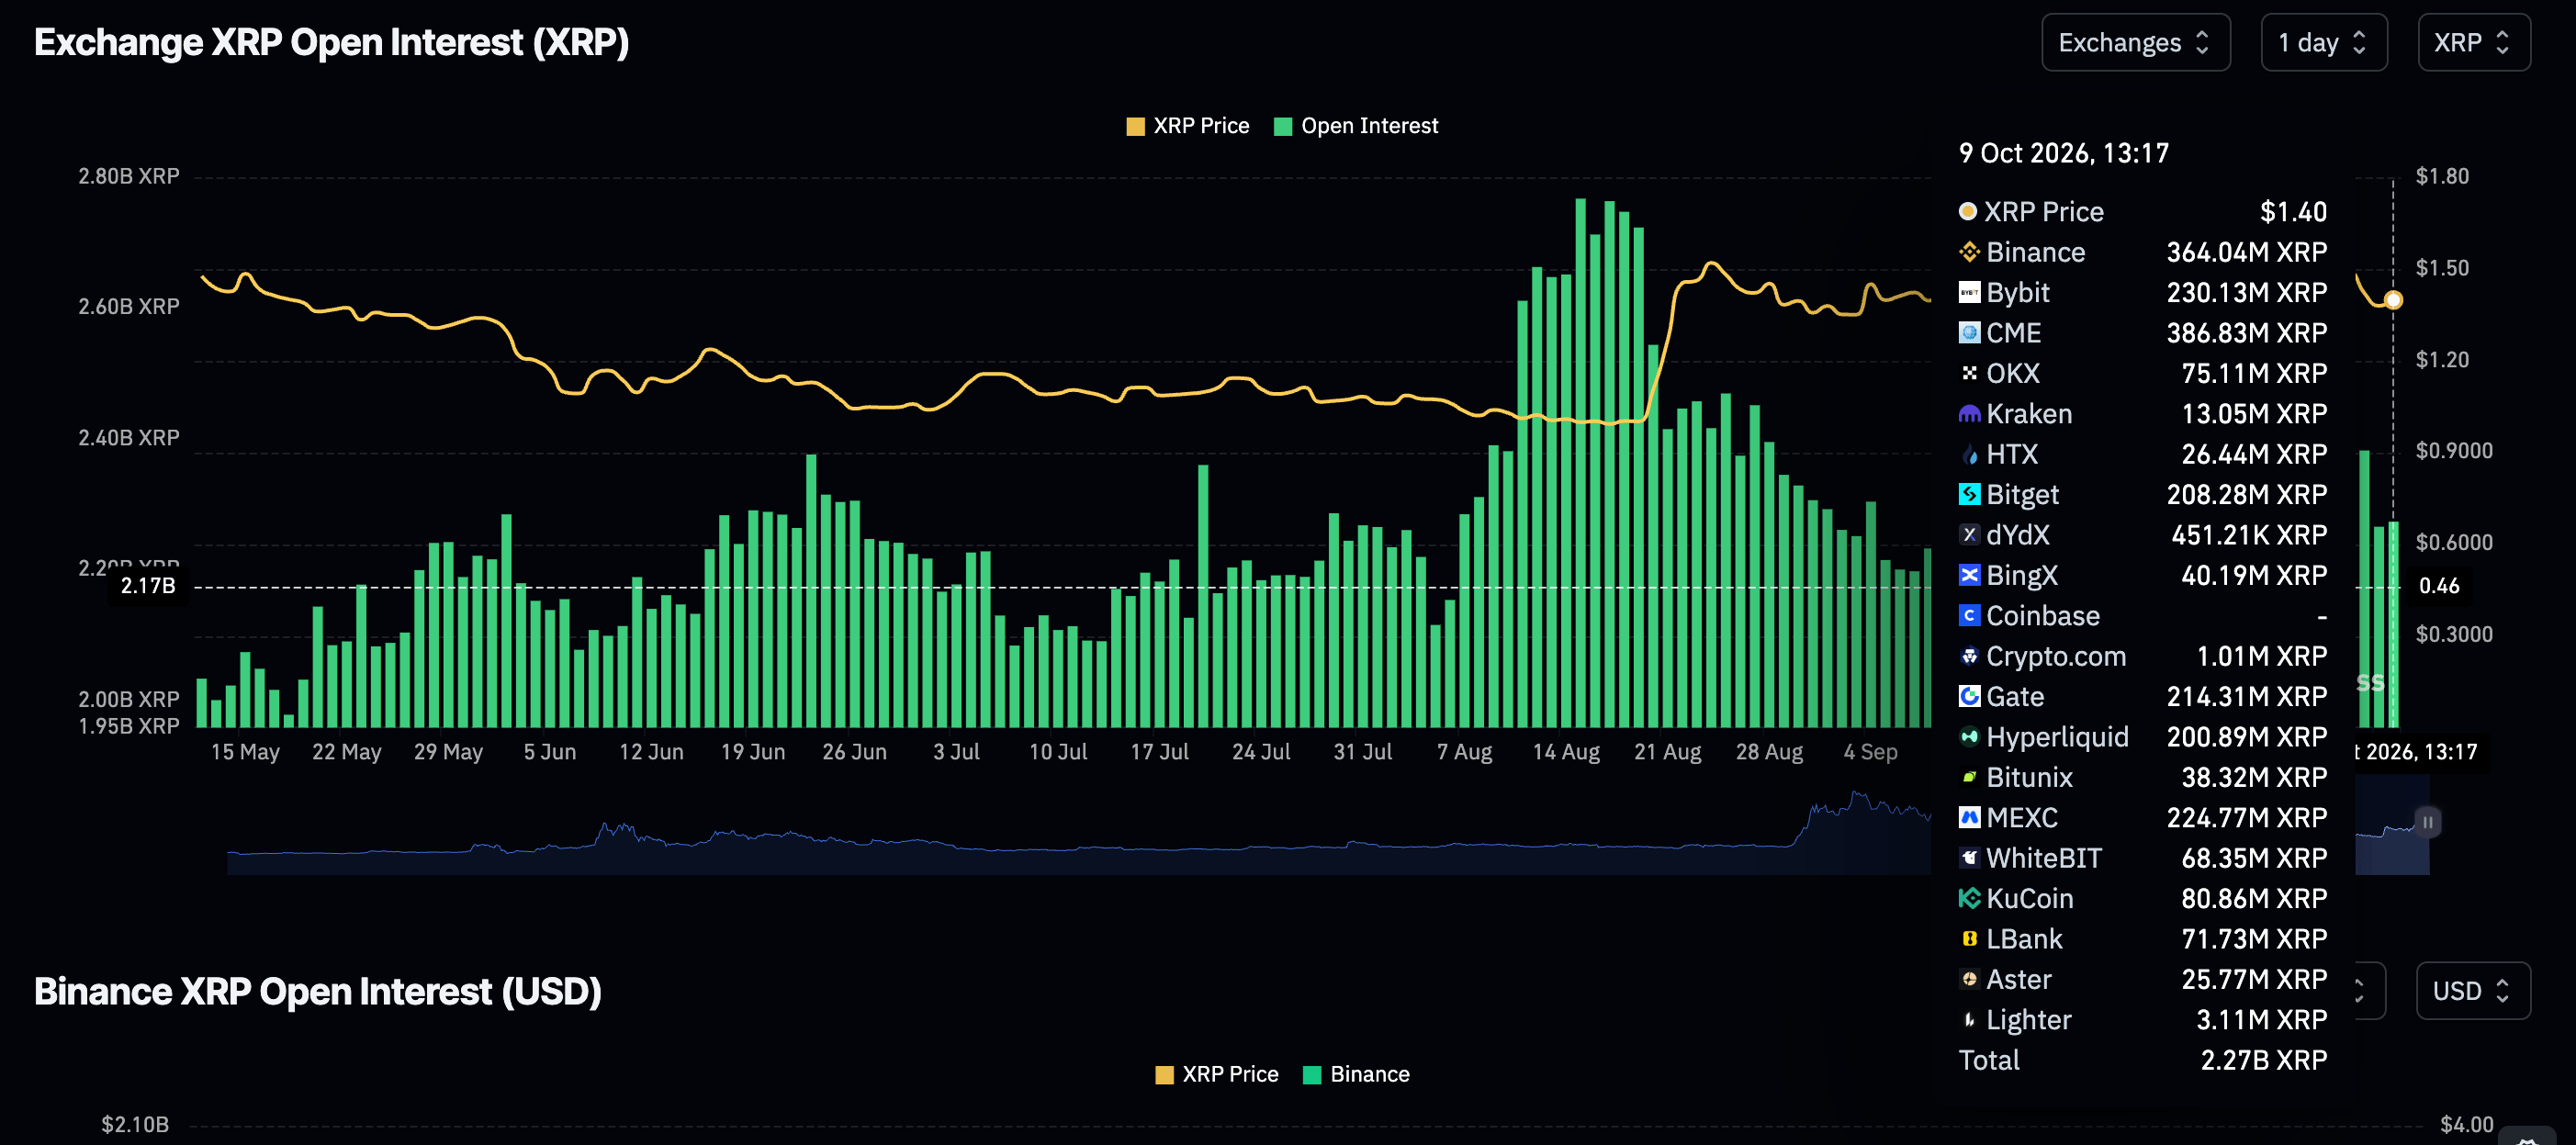
The derivatives market is facing cooling retail demand, as perpetual futures Open Interest (OI) drops to 2.3 billion XRP on Friday, from 2.4 billion the previous day. In comparison, OI pales next to the September peak of 2.5 billion XRP and the August high of 2.8 billion XRP. Diminishing retail demand implies a weaker tailwind to support a steady uptrend.
Technical analysis: XRP reclaims $1.40 demand area
XRP bulls are trying to take back control of the trend after this week's persistent pullback from highs around $1.53 to lows near $1.32. This recovery could be an uphill task, as investor focus shifts to next week's release of the United States (US) Consumer Price Index (CPI) report and the Federal Reserve (Fed) October monetary policy decision.
The pair holds above a dense cluster of Exponential Moving Averages (EMAs), while the SuperTrend at $1.30 reinforces the constructive backdrop. Despite this supportive structure, momentum is soft as the Relative Strength Index (RSI) near 44 drifts below midline and the Moving Average Convergence Divergence (MACD) remains negative with a weakly bearish tone, suggesting upside progress could be gradual rather than impulsive.
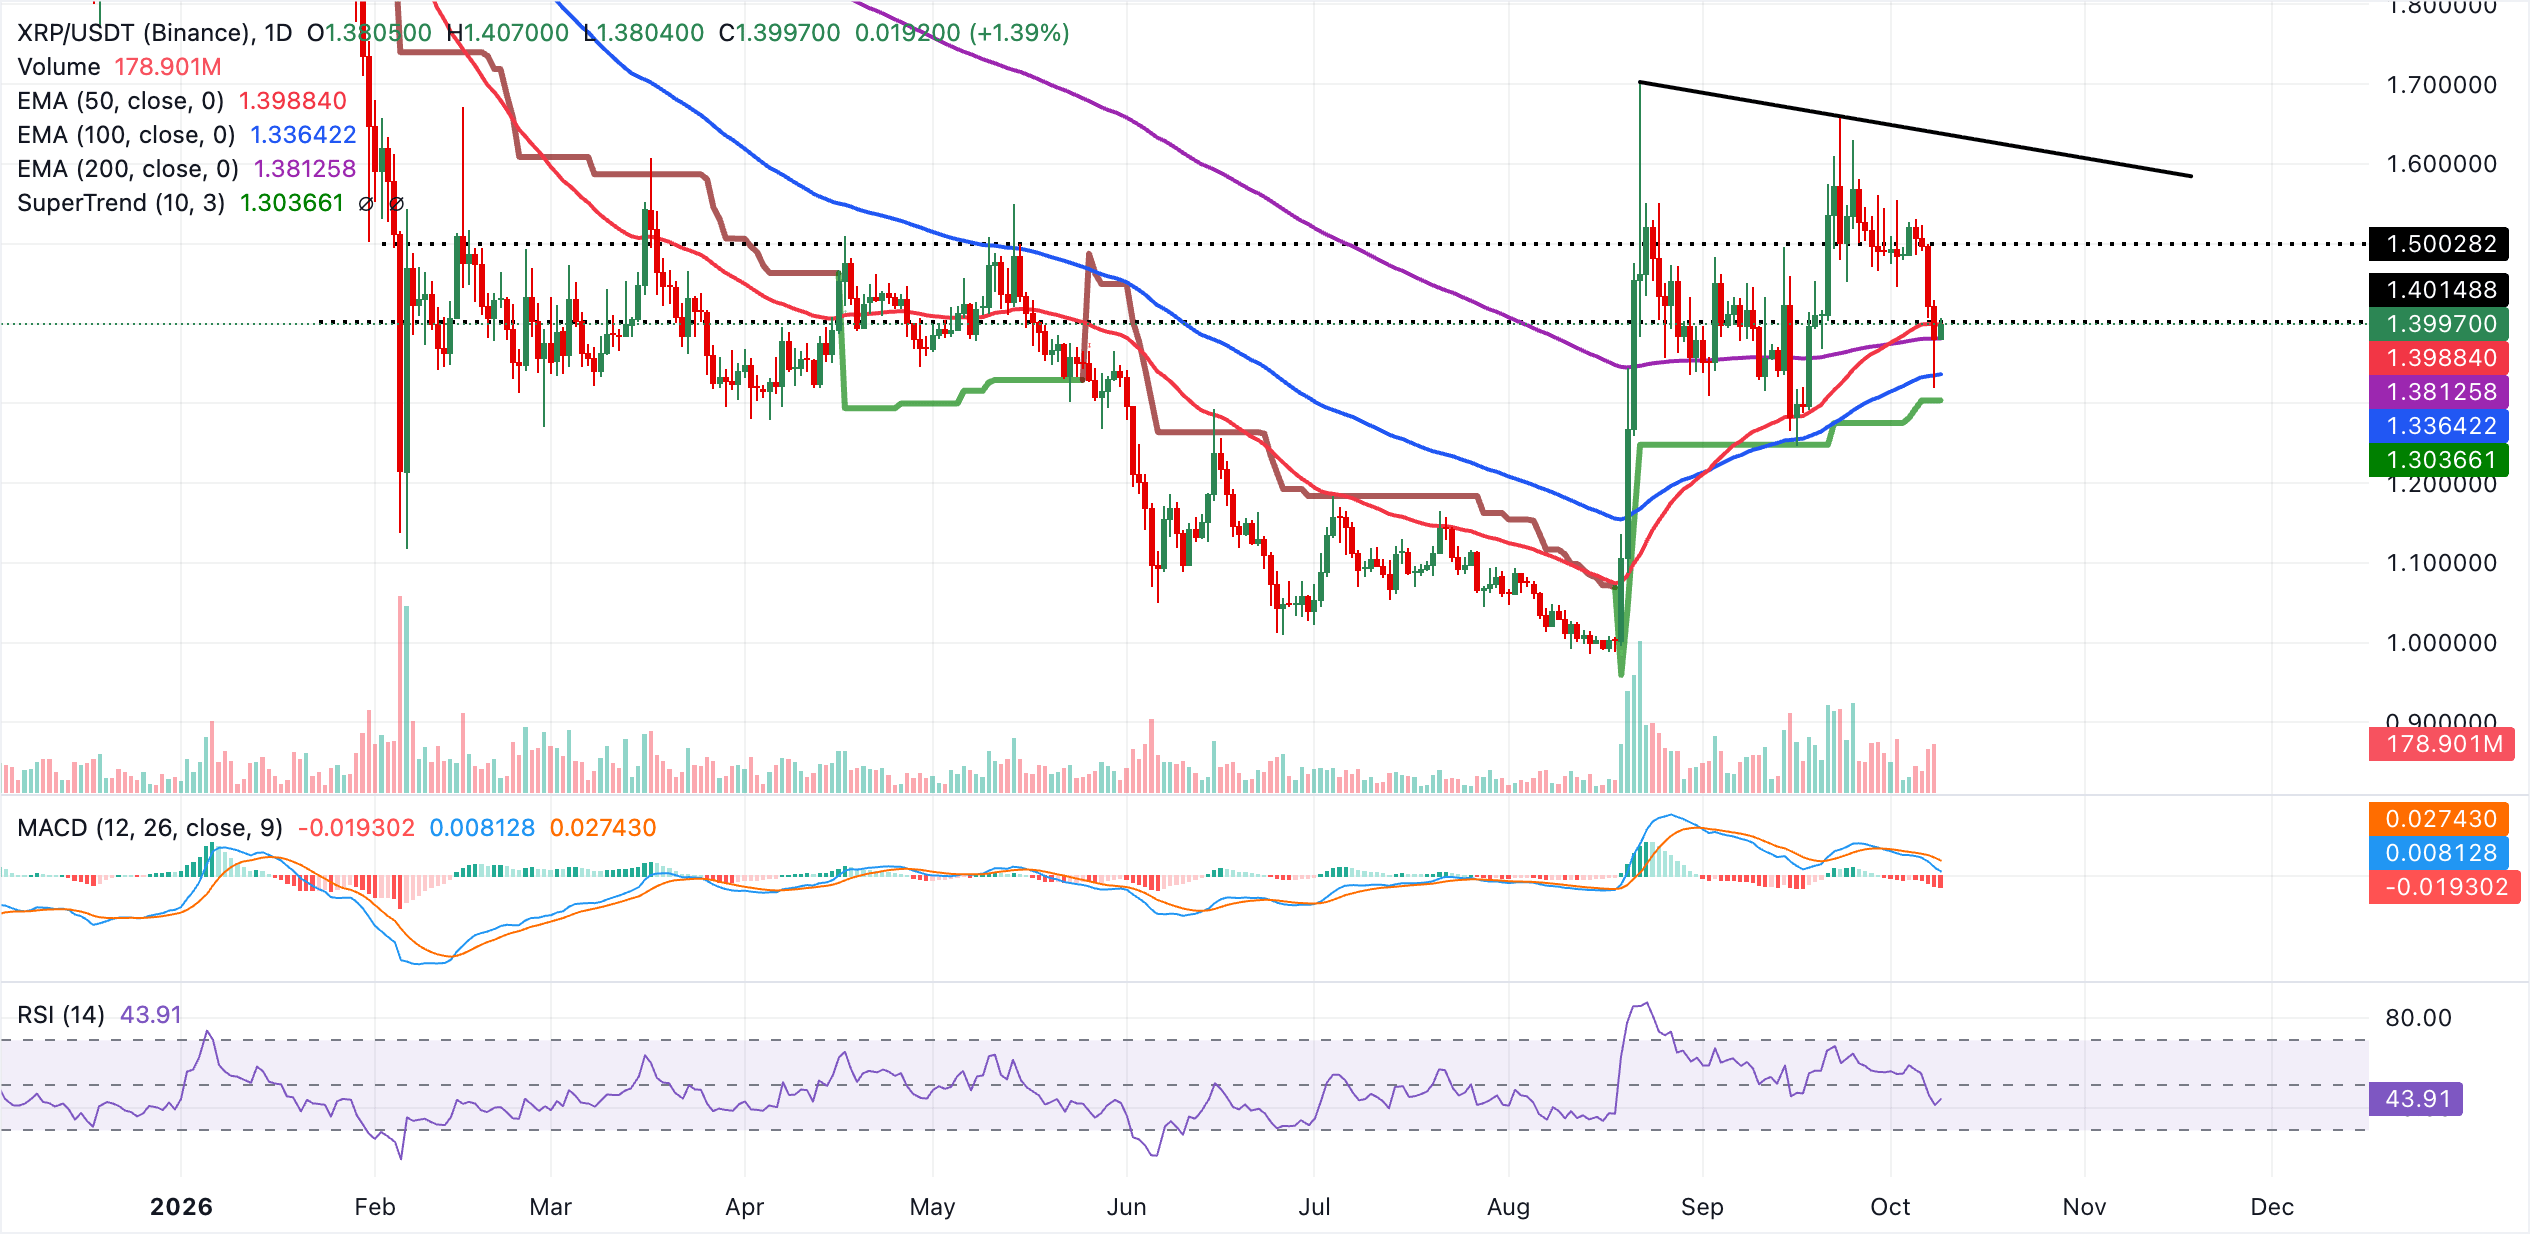
Immediate support is seen at the 50-day EMA near $1.40, followed by the 200-day EMA at $1.38 and then the 100-day EMA at $1.34, with the SuperTrend baseline around $1.30 marking a deeper bullish line in the sand. On the topside, the broader downtrend structure leaves the prior break zone near $1.64 as the first notable resistance, ahead of the higher trendline reference around $1.70, where sellers could reassert control if the rally extends.
XRP's outlook on the weekly timeframe remains neutral to bullish, with spot holding just above the 200-week EMA at $1.37 while capped by the 50-week EMA at $1.52 and the 100-week EMA at $1.58.
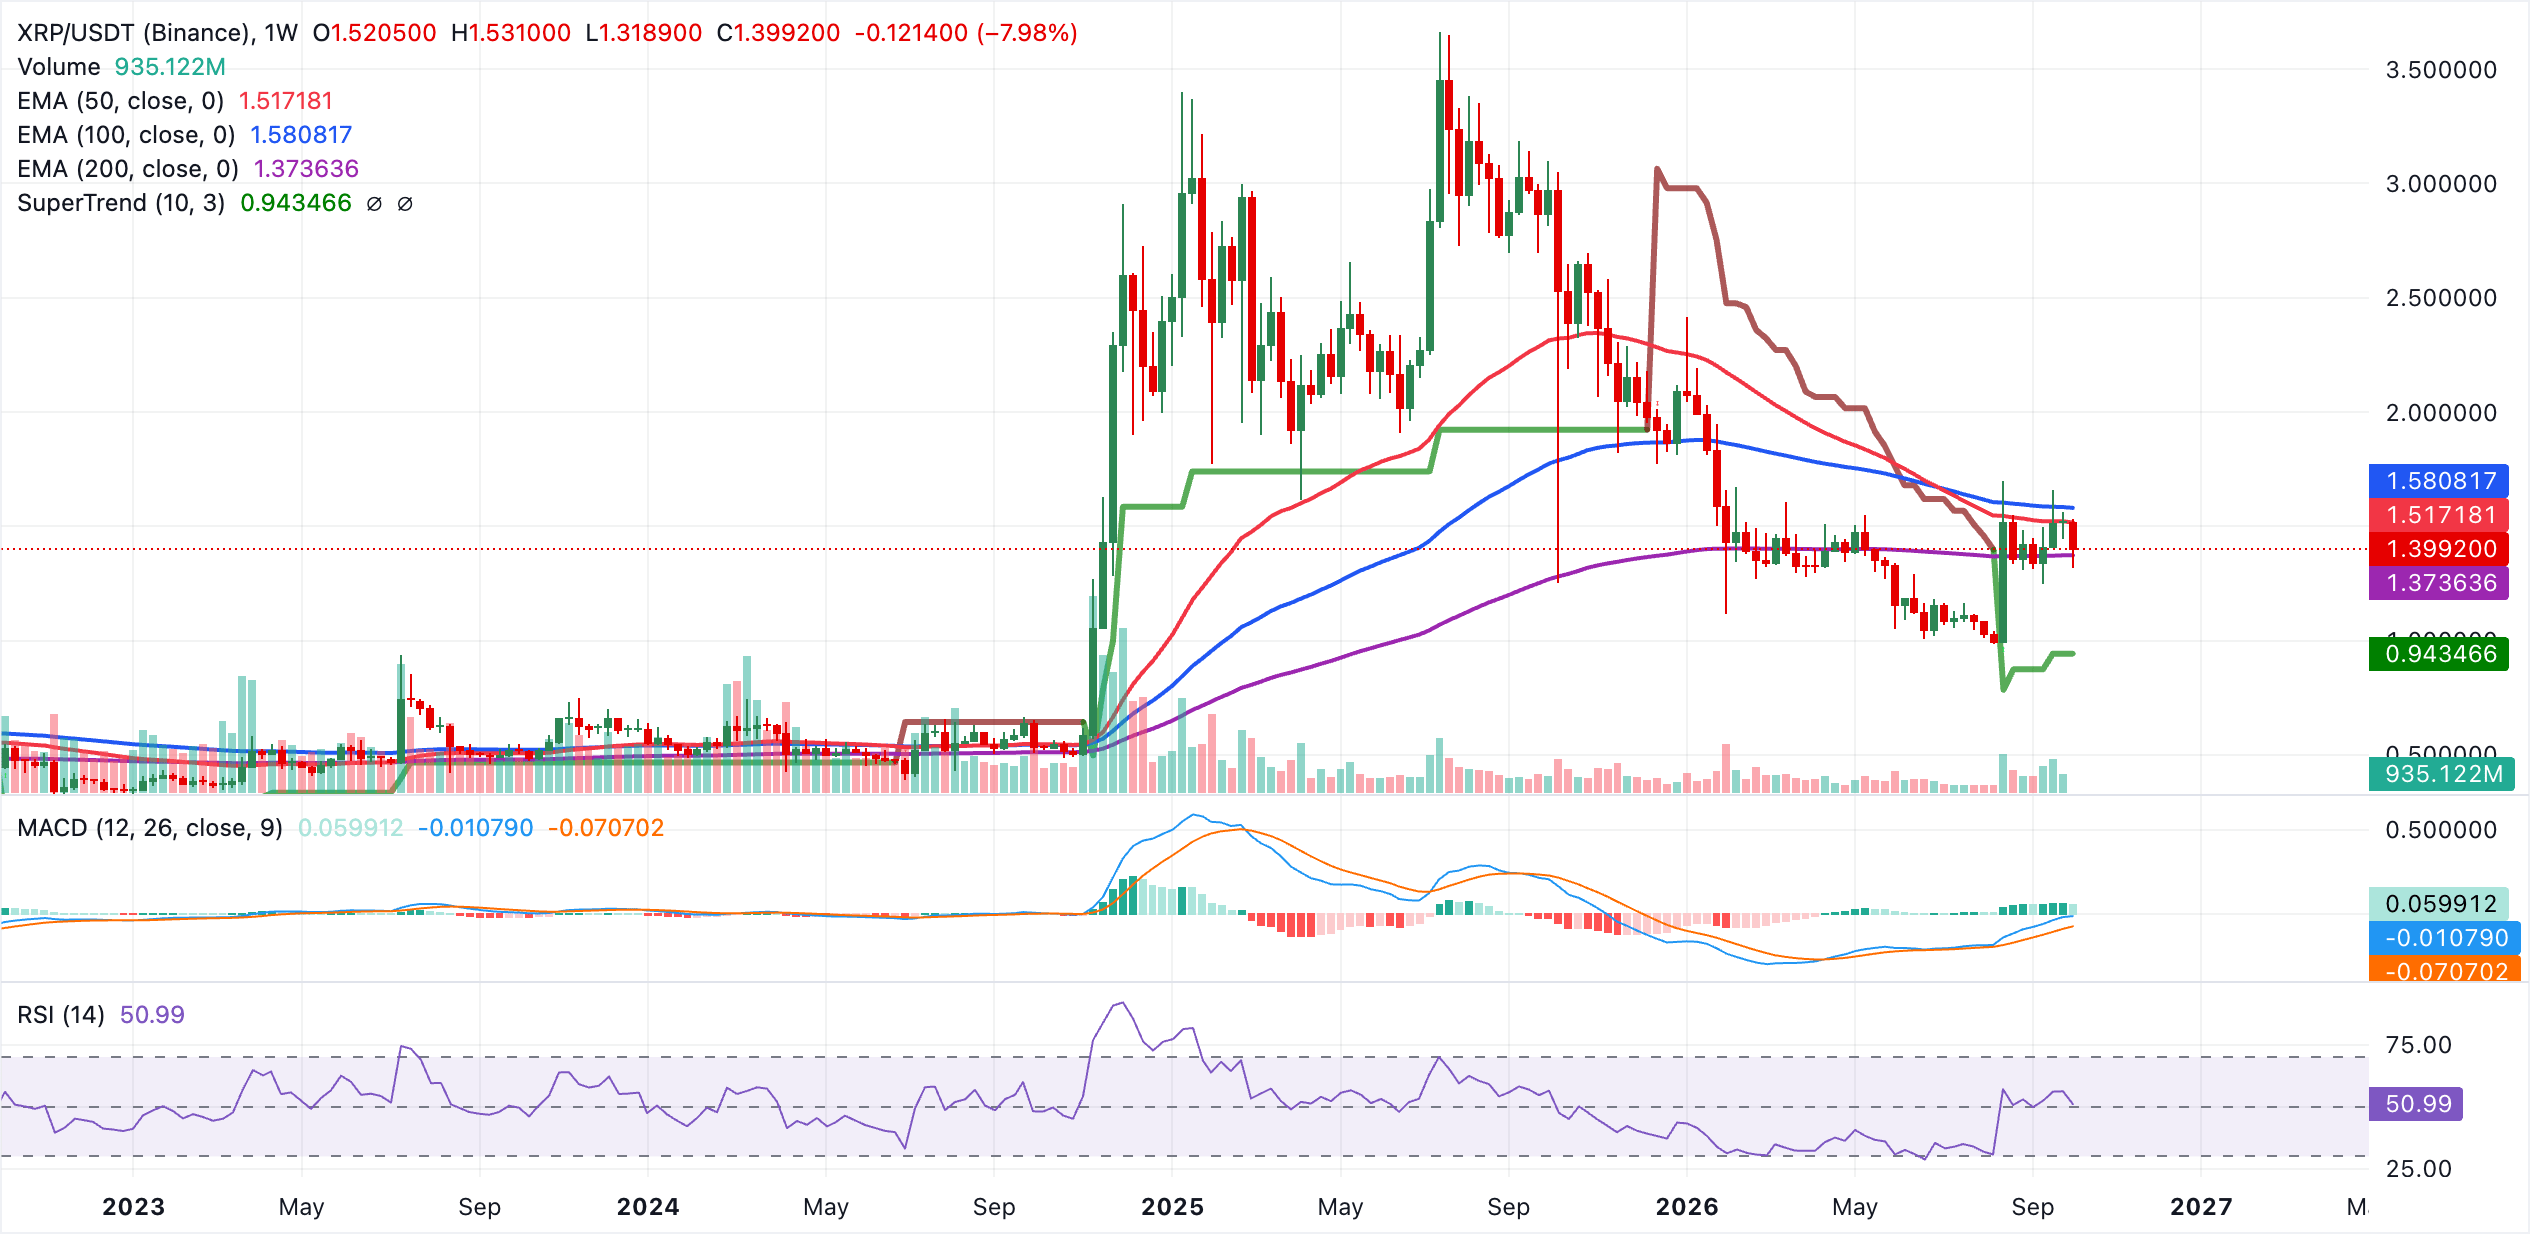
The SuperTrend line at $0.94 sits well below price and reinforces a medium-term floor, while the MACD indicator stays positive, hinting at mildly constructive momentum. The RSI around 51 underscores a balanced market, suggesting that bulls lack the conviction to reclaim the overhead trend EMAs for now.
(The technical analysis of this story was written with the help of an AI tool. Know more.)
Crypto ETF FAQs
An Exchange-Traded Fund (ETF) is an investment vehicle or an index that tracks the price of an underlying asset. ETFs can not only track a single asset, but a group of assets and sectors. For example, a Bitcoin ETF tracks Bitcoin’s price. ETF is a tool used by investors to gain exposure to a certain asset.
Yes. The first Bitcoin futures ETF in the US was approved by the US Securities & Exchange Commission in October 2021. A total of seven Bitcoin futures ETFs have been approved, with more than 20 still waiting for the regulator’s permission. The SEC says that the cryptocurrency industry is new and subject to manipulation, which is why it has been delaying crypto-related futures ETFs for the last few years.
Yes. The SEC approved in January 2024 the listing and trading of several Bitcoin spot Exchange-Traded Funds, opening the door to institutional capital and mainstream investors to trade the main crypto currency. The decision was hailed by the industry as a game changer.
The main advantage of crypto ETFs is the possibility of gaining exposure to a cryptocurrency without ownership, reducing the risk and cost of holding the asset. Other pros are a lower learning curve and higher security for investors since ETFs take charge of securing the underlying asset holdings. As for the main drawbacks, the main one is that as an investor you can’t have direct ownership of the asset, or, as they say in crypto, “not your keys, not your coins.” Other disadvantages are higher costs associated with holding crypto since ETFs charge fees for active management. Finally, even though investing in ETFs reduces the risk of holding an asset, price swings in the underlying cryptocurrency are likely to be reflected in the investment vehicle too.
Nothing in this material constitutes investment advice, personal recommendation, investment research, an offer, or a solicitation to buy or sell any financial instrument. The content has been prepared without consideration of your individual investment objectives, financial situation, or needs, and should not be treated as such.
Past performance is not a reliable indicator of future performance and/or results. Forward-looking scenarios or forecasts are not a guarantee of future performance. Actual results may differ materially from those anticipated.
Mitrade makes no representation or warranty as to the accuracy or completeness of the information provided and accepts no liability for any loss arising from reliance on such information.
Recommended Articles


