



Micron Stock Price Forecast: $35 Billion Buyback Plan Takes Effect in December, Will MU Uptrend Gain New Support?
TradingKey - Micron Technology (MU) is significantly boosting shareholder returns. In its latest Form 10-K filing, the company disclosed that its board of directors has approved an expansion of its share repurchase program, raising the maximum authorized amount for discretionary common stock buybacks to $35.16 billion, effective December 9, 2026.
Micron's original buyback program was $10 billion, with approximately $2.2 billion currently remaining unused. This adjustment means the company will substantially increase its potential repurchase capacity beyond the original plan, reflecting management's confidence in future cash flows and long-term operating prospects.
Share buybacks typically increase earnings per share and improve the distribution efficiency of free cash flow by reducing the number of shares outstanding. Assuming stable corporate profits, a reduction in share count directly raises earnings per share and helps mitigate dilution pressure from employee stock incentives to some extent.
For Micron, the $35.16 billion authorization is substantial, demonstrating that the company has ample capital allocation flexibility against the backdrop of rapidly growing demand for AI memory and rising DRAM and NAND prices. The buyback program also signals to the market that, despite significant gains in its stock price this year, management still believes its shares hold long-term investment value.
Source: TradingView
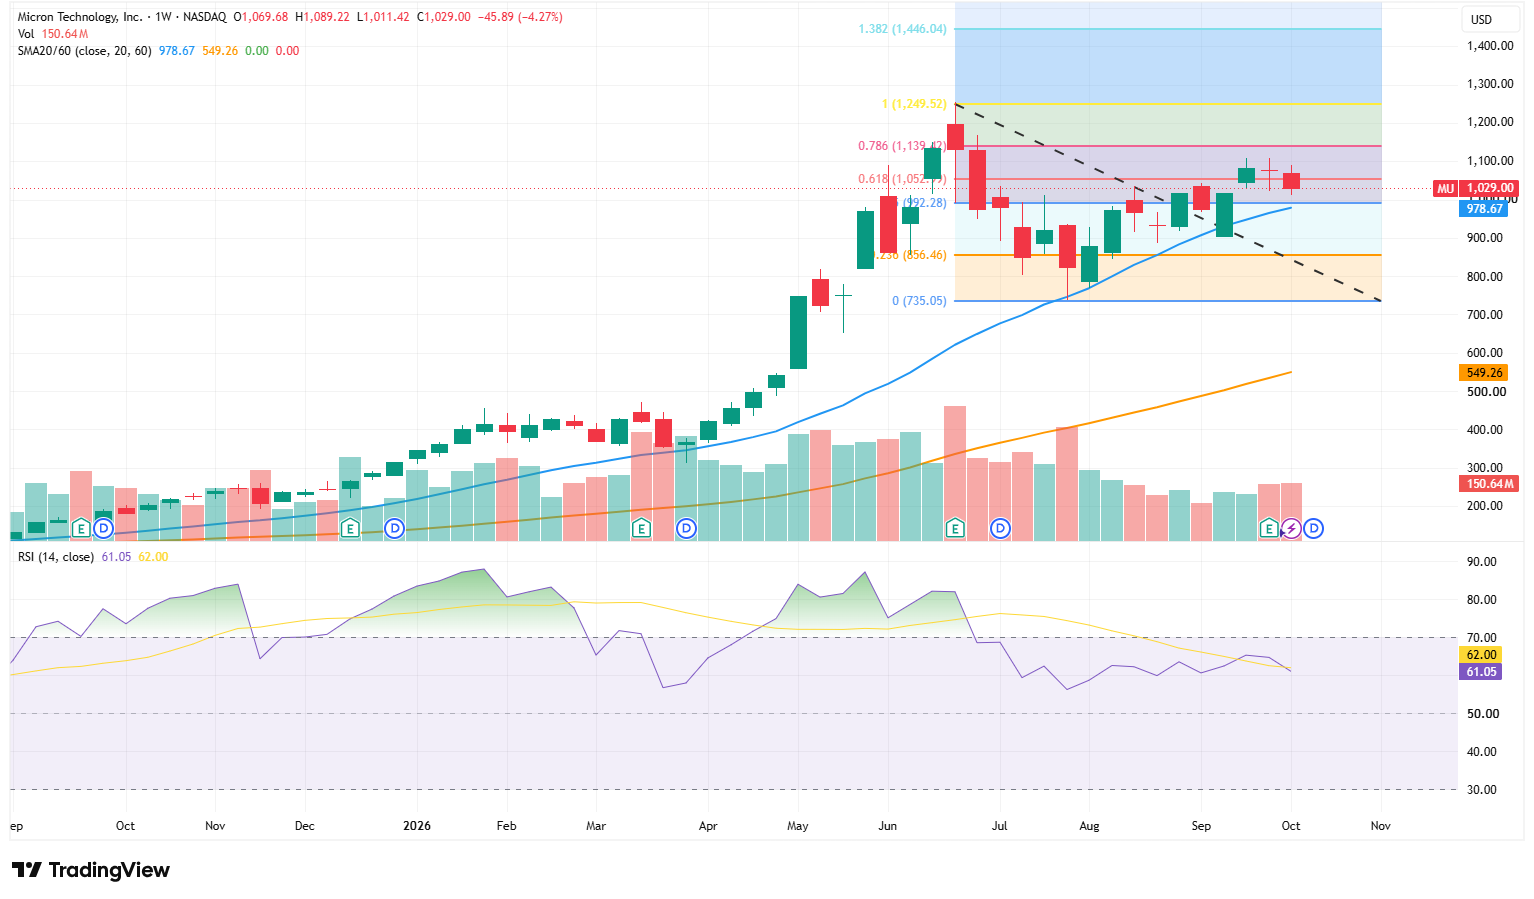
On the weekly chart, Micron's stock was trading at $1,029, down 4.27% this week, entering high-level consolidation after a rapid rally. Despite the short-term pullback, the stock remains above its 20-week moving average of $978.67, which continues to slope upward and sits significantly above the 60-week moving average of $549.26, indicating that the medium- to long-term uptrend structure remains intact.
Fibonacci levels show that the 0.618 retracement level near $1,052 has become short-term resistance. If the stock can regain a firm footing above $1,052, it is expected to further challenge the $1,080-$1,100 range; following a breakout, the next target would be the 0.786 level at $1,139, while in a strong scenario, it could retest the previous high of $1,249. A breakout above $1,249 points to a Fibonacci extension target of approximately $1,446.
On the downside, initial focus is on the $992-$979 support zone, where $992 corresponds to the 0.5 retracement level and around $979 aligns with the 20-week moving average. If the weekly chart decisively breaks below this area, the adjustment could expand toward $900, with further support near $856.
The RSI currently stands at 61.05, remaining above 50 to indicate a dominant bullish structure, though it has fallen slightly below its smoothed signal line of 62.00, reflecting some cooling in upward momentum. Recent trading volume has not expanded significantly either, meaning a breakout above $1,052-$1,100 will still require confirmation from incremental volume.
Nothing in this material constitutes investment advice, personal recommendation, investment research, an offer, or a solicitation to buy or sell any financial instrument. The content has been prepared without consideration of your individual investment objectives, financial situation, or needs, and should not be treated as such.
Past performance is not a reliable indicator of future performance and/or results. Forward-looking scenarios or forecasts are not a guarantee of future performance. Actual results may differ materially from those anticipated.
Mitrade makes no representation or warranty as to the accuracy or completeness of the information provided and accepts no liability for any loss arising from reliance on such information.
Recommended Articles


