



ECB’s Lane says energy shock could delay inflation’s return to 2%
The European Central Bank (ECB) Chief Economist Philip Lane stated that the European economy will expand steadily at a moderate pace if the energy shocks ease, according to Le Temps.
Lane said that a second surge in energy costs will push inflation higher before it eases towards the ECB’s 2% goal, from mid-2027 onwards.
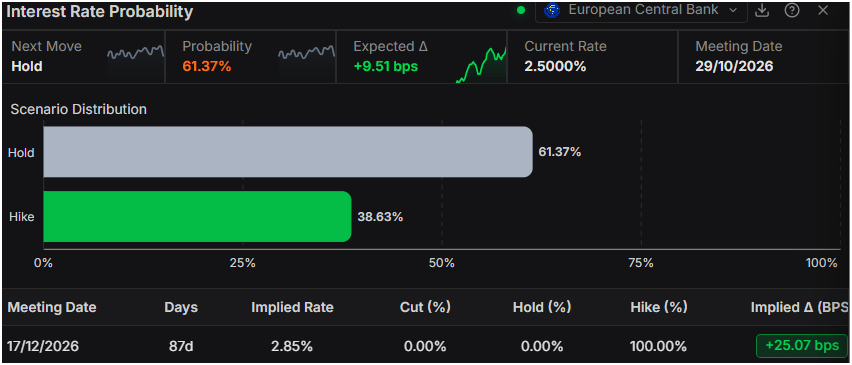
So far, money markets have priced in nearly 35 basis points of tightening by year-end but have fully priced in a rate hike by the December 17 meeting, revealed Prime Terminal.
Euro Price Today
The table below shows the percentage change of Euro (EUR) against listed major currencies today. Euro was the strongest against the Canadian Dollar.
| USD | EUR | GBP | JPY | CAD | AUD | NZD | CHF | |
|---|---|---|---|---|---|---|---|---|
| USD | 0.13% | 0.18% | 0.28% | 0.33% | 0.07% | 0.16% | -0.16% | |
| EUR | -0.13% | -0.01% | 0.11% | 0.13% | -0.12% | -0.05% | -0.34% | |
| GBP | -0.18% | 0.01% | 0.11% | 0.14% | -0.10% | -0.05% | -0.32% | |
| JPY | -0.28% | -0.11% | -0.11% | 0.06% | -0.25% | -0.11% | -0.39% | |
| CAD | -0.33% | -0.13% | -0.14% | -0.06% | -0.29% | -0.18% | -0.47% | |
| AUD | -0.07% | 0.12% | 0.10% | 0.25% | 0.29% | 0.10% | -0.20% | |
| NZD | -0.16% | 0.05% | 0.05% | 0.11% | 0.18% | -0.10% | -0.30% | |
| CHF | 0.16% | 0.34% | 0.32% | 0.39% | 0.47% | 0.20% | 0.30% |
The heat map shows percentage changes of major currencies against each other. The base currency is picked from the left column, while the quote currency is picked from the top row. For example, if you pick the Euro from the left column and move along the horizontal line to the US Dollar, the percentage change displayed in the box will represent EUR (base)/USD (quote).
ECB FAQs
The European Central Bank (ECB) in Frankfurt, Germany, is the reserve bank for the Eurozone. The ECB sets interest rates and manages monetary policy for the region. The ECB primary mandate is to maintain price stability, which means keeping inflation at around 2%. Its primary tool for achieving this is by raising or lowering interest rates. Relatively high interest rates will usually result in a stronger Euro and vice versa. The ECB Governing Council makes monetary policy decisions at meetings held eight times a year. Decisions are made by heads of the Eurozone national banks and six permanent members, including the President of the ECB, Christine Lagarde.
In extreme situations, the European Central Bank can enact a policy tool called Quantitative Easing. QE is the process by which the ECB prints Euros and uses them to buy assets – usually government or corporate bonds – from banks and other financial institutions. QE usually results in a weaker Euro. QE is a last resort when simply lowering interest rates is unlikely to achieve the objective of price stability. The ECB used it during the Great Financial Crisis in 2009-11, in 2015 when inflation remained stubbornly low, as well as during the covid pandemic.
Quantitative tightening (QT) is the reverse of QE. It is undertaken after QE when an economic recovery is underway and inflation starts rising. Whilst in QE the European Central Bank (ECB) purchases government and corporate bonds from financial institutions to provide them with liquidity, in QT the ECB stops buying more bonds, and stops reinvesting the principal maturing on the bonds it already holds. It is usually positive (or bullish) for the Euro.
Nothing in this material constitutes investment advice, personal recommendation, investment research, an offer, or a solicitation to buy or sell any financial instrument. The content has been prepared without consideration of your individual investment objectives, financial situation, or needs, and should not be treated as such.
Past performance is not a reliable indicator of future performance and/or results. Forward-looking scenarios or forecasts are not a guarantee of future performance. Actual results may differ materially from those anticipated.
Mitrade makes no representation or warranty as to the accuracy or completeness of the information provided and accepts no liability for any loss arising from reliance on such information.
Recommended Articles


