



TSMC (TSM) Breaks Q2 2026 Records, Then Falls 5%: Reason Explained
TradingKey -Taiwan Semiconductor Manufacturing (NYSE: TSM) issued Q2 2026 results on July 16 that exceeded all expectations: revenue of $40.2 billion, at the top of the guide, gross margin of 67.7% above the guide, net profit up 77% to about $22 billion, and full-year revenue growth guidance lifted to above 40% from above 30%. Capex was lifted to $60 to $64 billion and U.S. investment commitments to $265 billion. The stock dropped more than 5% on July 17 as the chip sector-wide selloff was exported to Asia. TSM is currently at approximately $406, below the previous $410 to $419 support zone and below both EMAs. RSI near 38. Support at $397.70, then $386.20. For recovery, we will need to close back above $419.
The Numbers That Did Not Stop the Selloff
TSMC's Q2 2026 actuals are as strong as they get. Revenue of $40.2 billion was right at the top of its $39 to $40.2 billion guide, up 36% year-on-year. Gross margin of 67.7% set a company record, above the top of the 65.5 to 67.5% guided range. Net profit of around NT$706.6 billion (or ~$22 billion) jumped 77% year-on-year and came in ahead of the NT$632.6 billion analyst consensus.
Net margin was 55.6%. For Q3, TSMC guided revenue of $44.6 to $45.8 billion, another sequential increase, with gross margin of 65 to 67% and operating margin of 56 to 58%. The Q3 step down in margin from Q2 record reflects overseas manufacturing cost ramp and currency impacts that management has indicated was a timing, rather than structural issue.
So the selloff is not at all about the numbers. Market analysts described the weakness as a reflection of extremely high investor expectations, rather than weak performance. It was in the wake of ASML results the day before, where guidance was lifted but shares ended the day lower.
There was a growing view among investors that the semiconductor's growth narrative was being overpriced already. "I am seeing this kind of aggressive pullback today and there is no negative headline, so I think all it says is how high the bar is set for the semiconductor earnings," said JPMorgan equity trader. This is the script that was followed by both ASML on July 15 and TSMC on July 16 and 17: beat the consensus, guide higher, sell.
The Capex Raise and the Free Cash Flow Question
The specific fear among the market is not TSMC's top line, but its capex. By lifting its 2026 capital expenditure range from $52 to $56 billion to $60 to $64 billion, it has significantly impacted the near-term free cash flow profile. Bloomberg points out that the narrative now pivots to what is next: higher capital expenditure and the added cost of expanding capacity abroad.
That investment drags near-term free cash flow, and if investors think the return is a long way off, they will pay less for every dollar of this quarter's earnings. TSMC also said it will spend another $100 billion in the US. That makes total US commitments $265 billion for fabs, packaging, and R&D in Arizona. The overarching lesson from this sell-off is that the AI boom is increasingly judged on next quarter's capex plans rather than this quarter's results. Good numbers may still be rejected in the current environment unless they deliver some incremental upside.
TSMC's FY26 full-year guidance is at over 40% (up from over 30%), which is a positive guidance revision, but at the same time they're also raising capex. Now investors are asking whether the revenue growth is getting converted to free cash flow that they can actually use, or if it's just ending up in new fabs in the Arizona desert. CEO C.C. Wei says TSMC performs an independent assessment of customer demand before each capex round; he says that's been one of the factors driving record profit margins for many years now. Whether the market recognizes that it still operates with that kind of discipline this week is a different question from whether the discipline actually exists.
TSM Technical Analysis: Below $410 to $419 Support, RSI 38, Key Levels
TSM technical setup below $410-$419 support, RSI at 38, and key levels. On the 4 hour chart, TSM at $406 is below $410-$419 former support, which is now resistance. 50 EMA at $430 and 200 EMA at $422 are both above price and confirm a negative near-term trend. RSI near 38 and still not oversold.
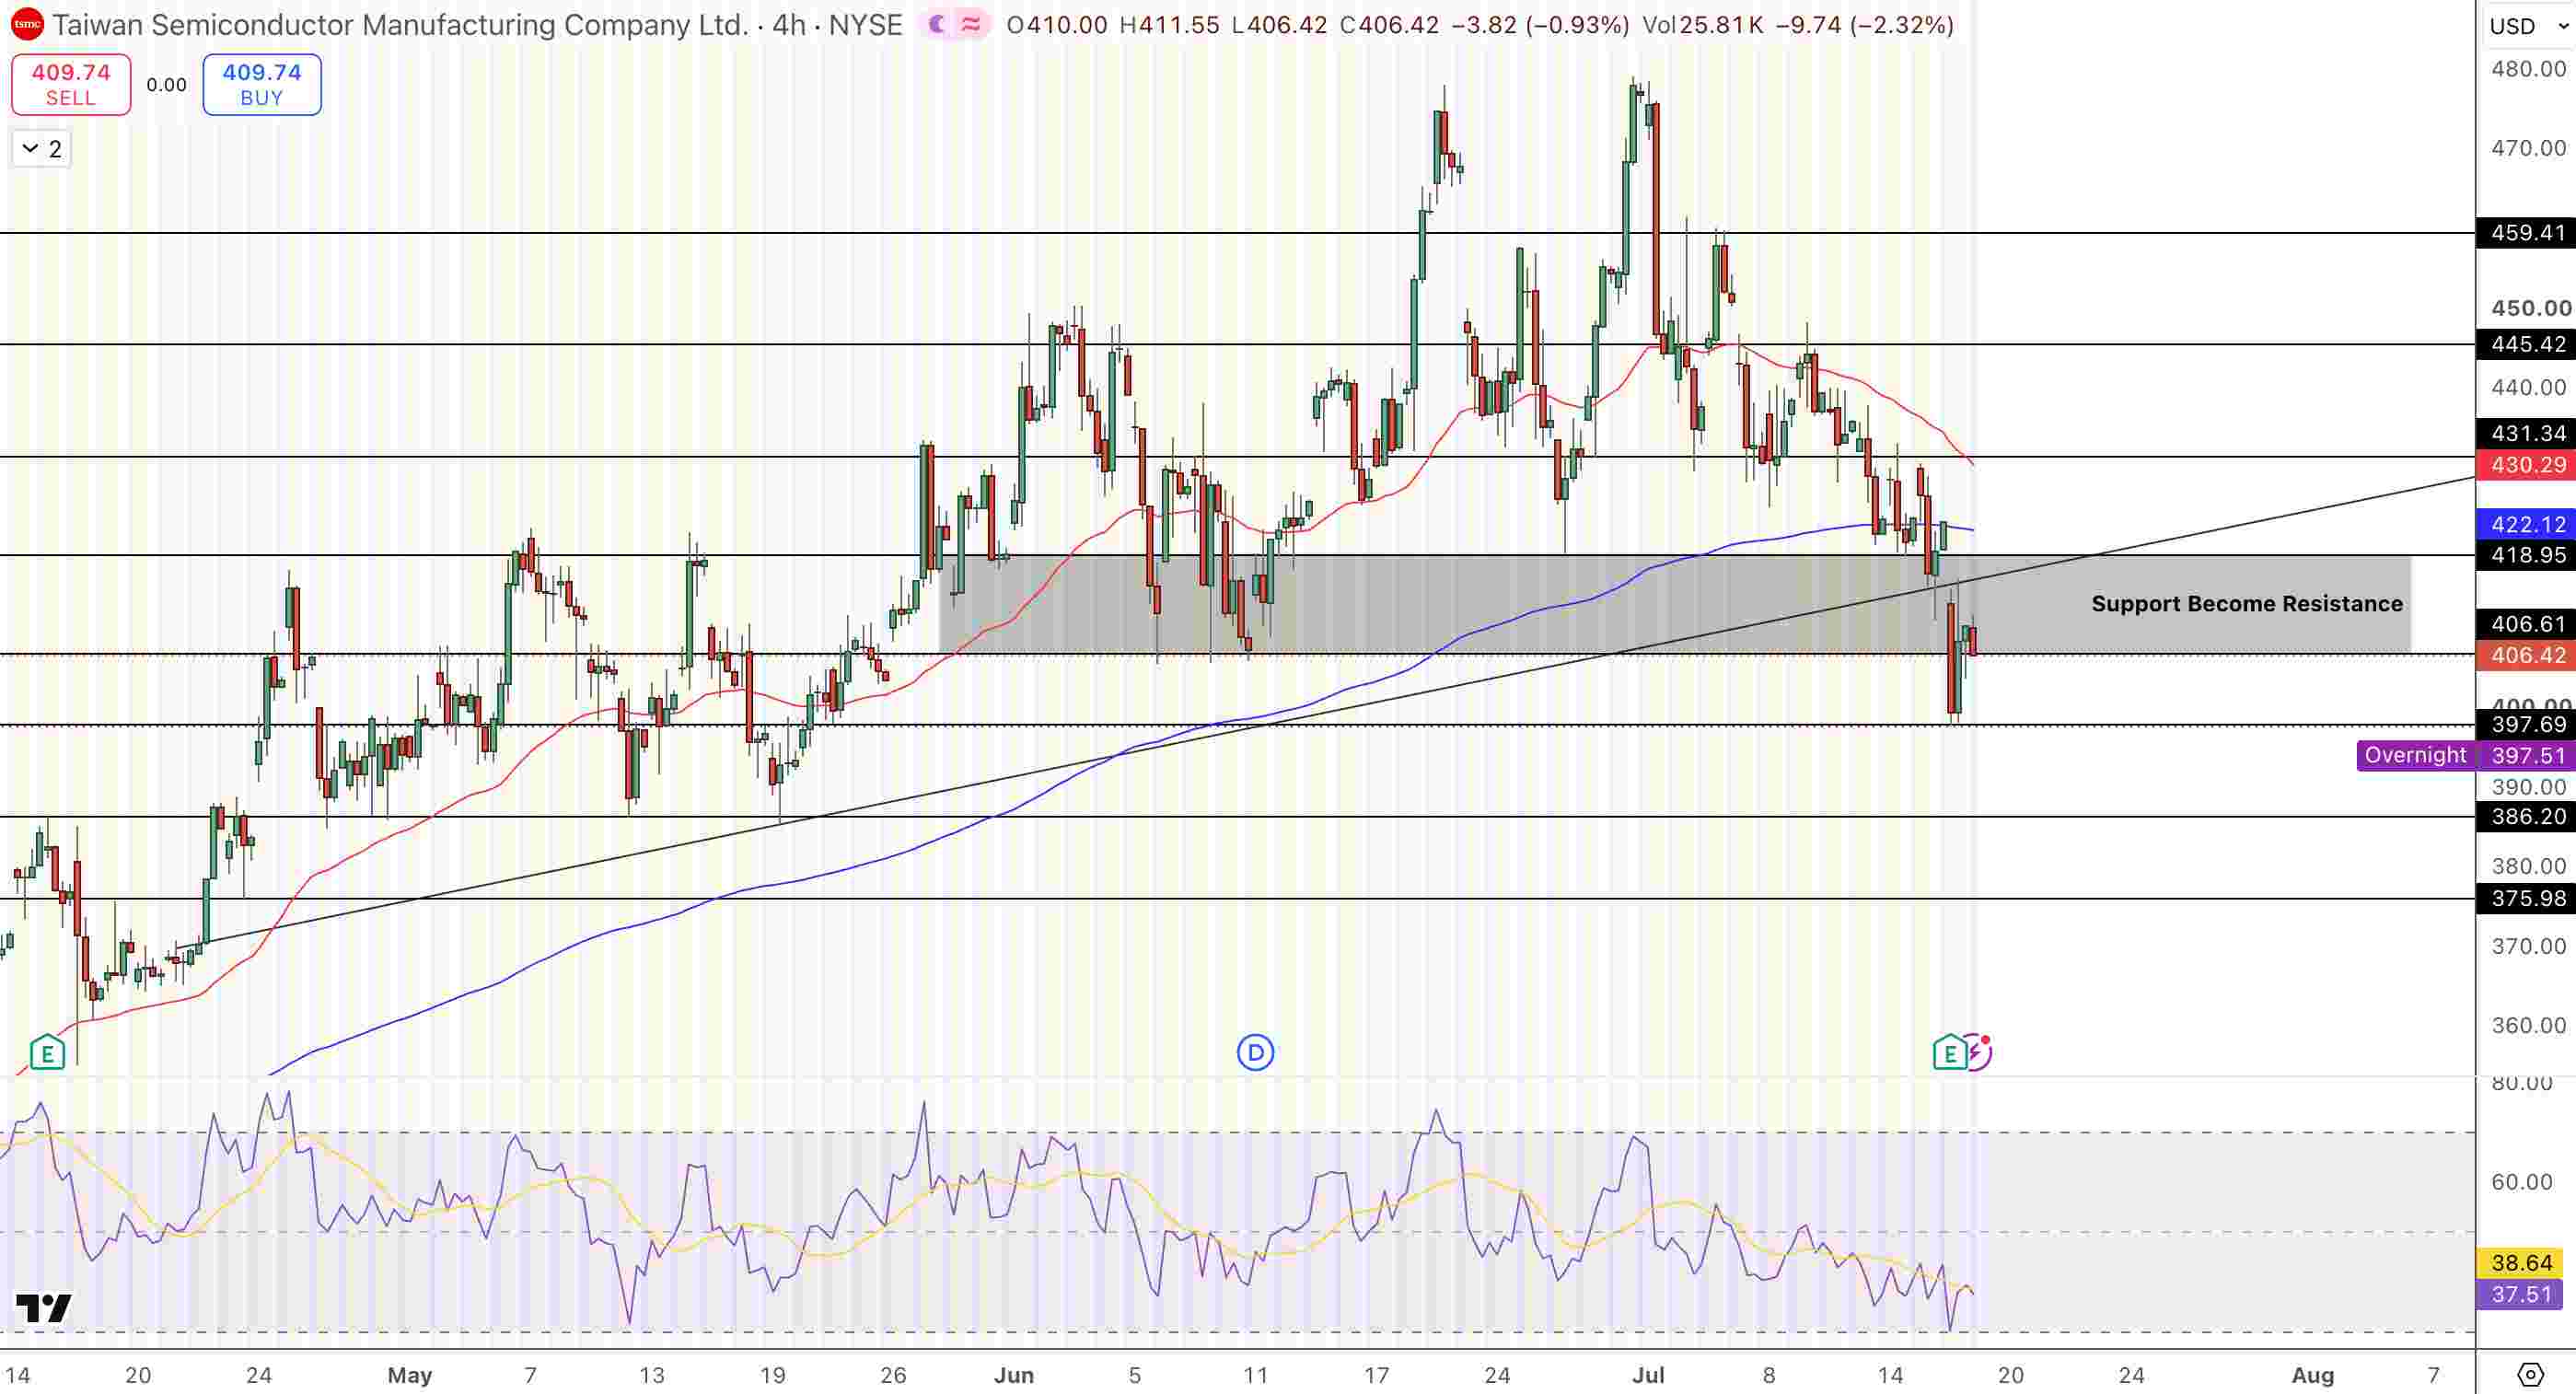
TSMC (TSM) Price Chart - Source: Tradingview
That leaves room to fall further before technicals attract buyers, with $397.70 being today's low where buyers defended the stock early this week, and $386.20 being the next support below. Recovery will require a 4 hour close above $419 to flip former support to neutral, then a 4 hour close above the 200 EMA to regain a constructive stance.
- Q2 actuals: Revenue $40.2B +36% YoY. Gross margin 67.7% record. Net profit +77% to ~$22B.
- Q3 guidance: Revenue $44.6 to $45.8B. Gross margin 65 to 67%. Op margin 56 to 58%.
- FY26 raised: 40%+ revenue growth (from 30%+). Capex $60 to $64B (from $52 to $56B).
- US investment: $265B total (additional $100B announced July 16).
- Support: $397.70 then $386.20.
- Resistance: $419 then 200 EMA at $422.
- Selloff cause: Capex raise compresses FCF. High bar priced in already. No negative headline.
Why Did TSMC Fall After Reporting Record Results?
TSMC’s Q2 results beat all expectations, with top-end revenue guidance achieved, Q2 gross margin at record 67.7%, Q2 net profit up 77%, and FY 2026 revenue guidance raised to +40% plus. It fell on the “news,” though the market had fully expected a great quarter. Capex guidance was also raised from $52-$56 billion to $60-$64 billion which led some to wonder whether free cash flows might be compressing.
In a call to clients a JPMorgan equity trader commented that the sell-off was “hard to pinpoint as a specific reason…there’s no real negative news to point to that was really the main culprit. I think the takeaway was it just shows how elevated the bar has gotten for semis given the past few months of outperformance for names in this space as a result of all the AI excitement,” while the same thing had happened the day before with the ASML earnings call.
What Is TSMC's Q3 2026 Revenue Guidance?
TSMC guided revenue for the July-September 2026 quarter to $44.6 to $45.8 billion. Revenue was $33.1 billion in Q3 2025, and was $40.2 billion just last quarter. A midpoint of $45.2 billion implies continued sequential growth of Q2 revenue. Gross margin guidance of 65-67% compares with last quarter’s record 67.7% and includes the impact of higher overseas ramp costs as well as currency. Operating margin guidance of 56-58% compares with a record 60.3% in Q2. Management characterized this as timing rather than any structural issues.
What Does the $265 Billion US Investment Mean for TSMC?
Earlier in the year TSMC had announced a $165 billion commitment for an extensive US manufacturing footprint. On July 16 the firm added an additional $100 billion which brings the total to $265 billion possibly spanning four more facilities. So far eight sites, including advanced packaging plants, have been announced in Arizona.
Given the higher cost structure for labor and construction for US fabs versus the more mature sites in Taiwan it’s easy to see why the capex increase was viewed as a negative despite the massive revenues and profits being delivered. In an era where resiliency in supply chains is of utmost importance, this investment will likely pay dividends to the long term as customers increasingly demand chips that are made in a geographically diverse manner.
Bottom Line
TSMC reported a quarter for the record books: Q2 2026 revenue at the high end of expectations at $40.2 billion, Q2 gross margin 67.7%, a record, Q2 net profit up 77%, FY 2026 full year revenue guidance raised to greater than 40% plus, US investment commitment raised to $265 billion and the stock was down 5-plus%. This was because of the capex guidance being raised to a range of $60-$64 billion, which led some to ask whether free cash flows are now compressing. Additionally, the entire semiconductor sector has been so strong of late that the market was pricing in these results.
TSM is now at $406, which is below the former area of support ranging from $410 to $419. The next major level on the downside to hold is $397.70. Hold there and $386.20 opens up. The market will have to see a close above $419 first before $419 can come back into play followed by the 200 day EMA which stands at $422 now. RSI is approaching oversold territory at 38, but still has quite a way to go.
Nothing in this material constitutes investment advice, personal recommendation, investment research, an offer, or a solicitation to buy or sell any financial instrument. The content has been prepared without consideration of your individual investment objectives, financial situation, or needs, and should not be treated as such.
Past performance is not a reliable indicator of future performance and/or results. Forward-looking scenarios or forecasts are not a guarantee of future performance. Actual results may differ materially from those anticipated.
Mitrade makes no representation or warranty as to the accuracy or completeness of the information provided and accepts no liability for any loss arising from reliance on such information.
Recommended Articles


