



Nvidia Stock Price Forecast: Will Shares Hit New Highs Amid $500 Billion AI Infrastructure Financing Talks With Blackstone and BlackRock?
Tradingkey - According to the Financial Times, Nvidia ( NVDA) is in talks with several Wall Street giants on a massive AI infrastructure financing plan of up to $500 billion, with funds potentially allocated to key areas such as data centers, chip procurement, and power supply. The deal could be announced as early as Monday, though the financing structure, specific projects, and whether the funds represent new commitments remain undisclosed.
Institutions involved in the talks include Apollo, Blackstone, BlackRock's Global Infrastructure Partners, Brookfield Asset Management, Goldman Sachs, and KKR. If finalized, the plan would become one of the largest financing arrangements in the AI infrastructure sector, highlighting the accelerating influx of private capital from Wall Street into computing power construction.
Nvidia has recently continued to deepen its capital support for the AI ecosystem. Last month, the company expanded its partnership with South Korea's SK Group, with both parties stating that the scale of future cooperation will exceed $500 billion. Meanwhile, Nvidia is also in discussions to provide up to $250 billion in support for OpenAI to lease US data center computing power, and is considering arranging $350 billion in financing for OpenAI's procurement of Nvidia chips.
Notably, this intertwined "investment, financing, and procurement" model has raised market concerns over whether demand is being artificially amplified by circular funding. Nvidia provides financial support to customers and infrastructure projects, which may in turn use the funds to purchase its chips and computing services, drawing closer scrutiny to the actual demand and return on investment behind the AI investment boom.
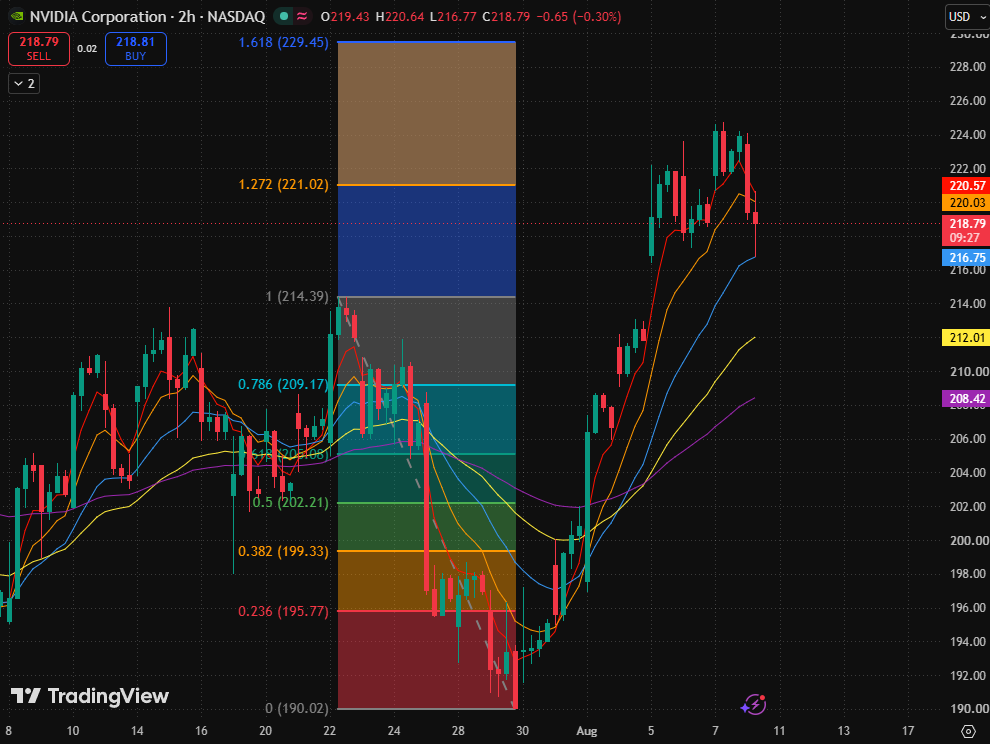
Nvidia 2-Hour Stock Price Chart, Source: TradingView
Looking at Nvidia's stock chart, after breaking through its previous high ($214.39), the price briefly tested the $224 level before pulling back. Currently, the price has fallen below the 1.272 Fibonacci extension level ($221.02), shifting from a short-term accelerated upward attack to a post-breakout pullback and confirmation phase. However, it continues to run above the 20-day, 40-day, and 80-day moving averages, and the medium-to-short-term upward structure remains intact.
In terms of moving averages, the 5-day and 10-day moving averages remain near $220, turning into overhead resistance due to the short-term pullback. However, the 20-day moving average is around $216.73, and the 40-day and 80-day moving averages are near $212 and $208.42, respectively, maintaining an overall bullish alignment. The current pullback is more akin to a moving average correction after a rapid rally, and the next key factor to watch is whether the stock price can reclaim and hold the $220–$221 range.
The primary short-term support to watch is near the 20-day moving average ($216.73), which is also close to the region above the previous high ($214.39). If the price stops falling in this area, the strong post-breakout structure is likely to continue. The second support level below is at the 0.786 Fibonacci retracement level ($209.17), which, together with the vicinity of the 80-day moving average, forms a strong support zone.
In terms of upside, if the price reclaims the 1.272 Fibonacci extension level ($221.02) and breaks through the recent high near $224, the pullback can be viewed as a normal technical consolidation within the uptrend, with the next target aiming for the 1.618 Fibonacci extension level ($229.45).
Nothing in this material constitutes investment advice, personal recommendation, investment research, an offer, or a solicitation to buy or sell any financial instrument. The content has been prepared without consideration of your individual investment objectives, financial situation, or needs, and should not be treated as such.
Past performance is not a reliable indicator of future performance and/or results. Forward-looking scenarios or forecasts are not a guarantee of future performance. Actual results may differ materially from those anticipated.
Mitrade makes no representation or warranty as to the accuracy or completeness of the information provided and accepts no liability for any loss arising from reliance on such information.
Recommended Articles


