



Broadcom Stock Price Forecast: Shares Drop Below $400 as AI Financing Platform Sparks Risk Concerns
TradingKey - Financing risks behind Broadcom's AI expansion are drawing market attention. On August 14 Eastern Time, Broadcom (AVGO) shares fell below the $400 mark.
It is reported that Bank of America analyst Tom Curcuruto downgraded Broadcom's issuer and bond ratings, with the core concern coming from the AI XPV financing platform built jointly with Apollo and Blackstone.
The platform's first transaction is valued at approximately $35 billion, primarily to build over 1 gigawatt of AI computing power for Anthropic, with funds used to procure equipment featuring Broadcom's custom XPUs, which will then be delivered to customers via leasing. The platform aims to expand to 20 gigawatts by 2028.
Unlike traditional chip sales, institutional investors bear the upfront equipment procurement while customers repay through lease payments; Broadcom provides residual value guarantees for certain senior debt, helping to lower financing costs.
This means that Broadcom does not directly assume all of the platform's debt; however, if a customer defaults and proceeds from equipment disposition are insufficient, the company may need to make up part of the lease or residual value shortfall. Broadcom disclosed in its latest Form 10-Q that the maximum theoretical loss exposure for the first transaction could reach $29 billion, assuming a complete customer default and zero equipment recovery value.
According to Reuters citing Bank of America calculations, if the platform expands at a rate of 2 gigawatts per quarter, the maximum exposure of related residual value guarantees could reach $370 billion by mid-2029; under an extreme scenario of 100% default, potential losses would be about $42 billion. It should be noted that this is not debt that Broadcom has recognized or will directly issue, but rather a contingent risk calculation based on assumptions of platform expansion and extreme defaults.
As of late June 2026, Broadcom's total on-balance-sheet debt stood at approximately $64.9 billion, with cash and short-term investments of around $19.6 billion. Bank of America still raised its fiscal year 2026 revenue and EBITDA forecasts for Broadcom, reflecting continued optimism regarding AI chip demand and core business fundamentals. However, as the platform expands, the market will pay closer attention to customer concentration, the residual value of AI chips, the scope of guarantees, and whether related risks could further transmit to Broadcom's balance sheet.
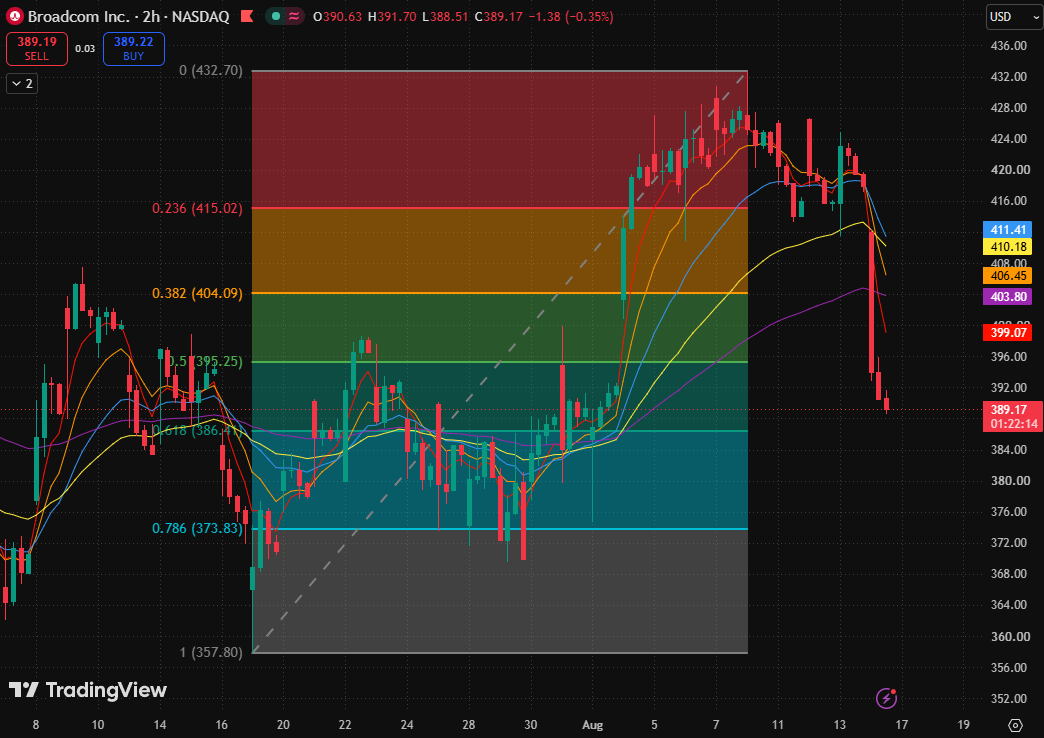
Broadcom 2-hour candlestick chart, Source: TradingView
Broadcom is currently undergoing a rapid pullback. After previously testing $432.70, the stock price has continued to weaken. The latest price has fallen below the 0.5 Fibonacci retracement level ($395.25) and is trading below the 5-day, 10-day, 20-day, 40-day, and 80-day moving averages, shifting the short-term technical structure from high-level consolidation to clearly bearish. The market is currently testing the buying support at key levels below.
Regarding moving averages, the 5-day and 10-day moving averages are accelerating downward, while the 20-day, 40-day, and 80-day moving averages cluster in the $399–$411 range, turning completely into overhead resistance. Previously, the stock price faced repeated resistance in the $420–$428 range before breaking downward, indicating loosening overhead positions; if it fails to reclaim $395.25 soon, the current downward structure may continue.
The primary short-term support lies at the 0.618 Fibonacci retracement level ($386.41), which is also the most critical bull-bear dividing line near current prices. If the 2-hour chart holds this position and signals a bottom, the stock price is expected to first rebound and recover toward the 0.5 Fibonacci retracement level ($395.25).
If $386.41 fails to hold, lower support levels are seen sequentially at the 0.786 Fibonacci retracement level ($373.83) and the periodic low ($357.80). To the upside, the stock must first reclaim $395.25 and break further above the 0.382 Fibonacci retracement level ($404.09) and the vicinity of the 80-day moving average to relieve the current weakness.
It should be noted that even if a technical bounce occurs, until the stock reclaims $395.25 and breaks above $404.09, it should still be viewed as a recovery following a breakdown rather than a trend turning strong again.
Nothing in this material constitutes investment advice, personal recommendation, investment research, an offer, or a solicitation to buy or sell any financial instrument. The content has been prepared without consideration of your individual investment objectives, financial situation, or needs, and should not be treated as such.
Past performance is not a reliable indicator of future performance and/or results. Forward-looking scenarios or forecasts are not a guarantee of future performance. Actual results may differ materially from those anticipated.
Mitrade makes no representation or warranty as to the accuracy or completeness of the information provided and accepts no liability for any loss arising from reliance on such information.
Recommended Articles


