



Ripple Price Forecast: XRP holds $1 support as ETF inflows, whale accumulation fuel recovery hopes
- XRP finds support around the $1 level on Friday, signaling potential recovery ahead.
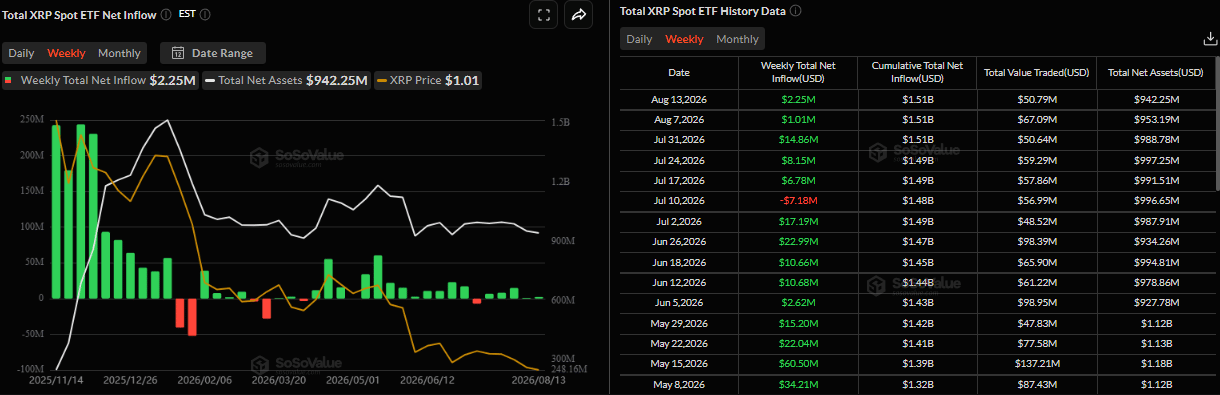
- Spot XRP ETF attracted $2.25 million in inflows through Thursday, pointing to a fifth consecutive week of positive flows.
- On-chain data shows XRP whales are quietly positioning, and the risk-reward is improving, suggesting easing downside pressure.
Ripple (XRP) price holds near the key $1 psychological support level on Friday, signaling potential for a recovery. US-listed spot XRP Exchange Traded Funds (ETFs) support recovery as they continued to attract institutional flows through Thursday, pointing to the fifth consecutive week of net inflows. Whale accumulation and improving risk-reward suggest downside pressure is easing and offer hope for a recovery.
Institutional demand remains robust
Institutional demand continues to show signs of strength so far this week. SoSoValue data shows that spot XRP ETFs recorded an inflow of $2.25 million through Thursday. If Friday shows positive flows, XRP is about to enter its fifth week of steady inflows.
These positive flows suggest institutional investors remain strong despite its ongoing price correction. If the trend extends through the end of the week, continued ETF demand could help cushion XRP’s downside and support a recovery ahead.
On-chain perspective shows XRP’s bottom is near
CryptoQuant on-chain metrics highlight that XRP whales are quietly positioning.
The chart below shows that XRP average spot order has been dominated by big-whale classifications throughout this year, while price holds the $1.0–$1.2 range.
-1786684288771.png)
However, on deeper analysis, XRP’s 90-day taker CVD has cooled to a neutral phase, indicating accumulation without aggression.
-1786684320675.png)
These on-chain metrics show that the risk-reward has improved markedly, but is not fully de-risked. Downside pressure is lower as large holders accumulate, signaling the last stage of the bear market.
From a valuation side, XRP’s realized price is currently around $0.75, below its market price of $1.01. This indicates that XRP is approaching, but has not yet reached, the deeply undervalued levels that have historically coincided with previous cycle lows.
-1786684348130.png)
XRP technical outlook: Recovers after finding support at $1.00
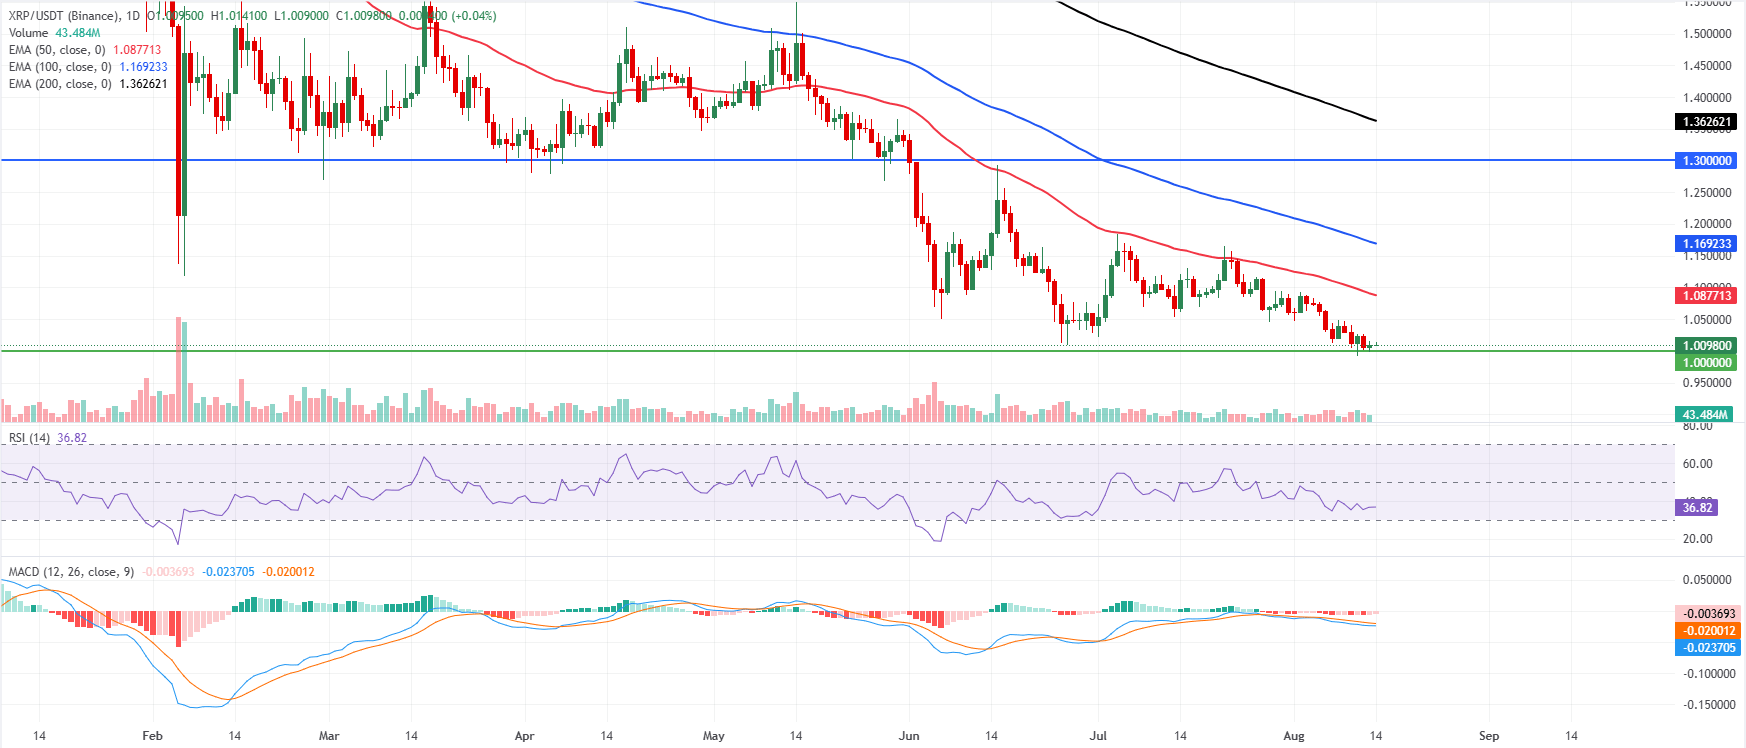
XRP price trades at $1.009 on Friday, rebounding after finding support around the key $1.000 mark the previous day. Despite the recovery, XRP retains a bearish bias, with the price remaining below the 50-day EMA at $1.087, the 100-day EMA at $1.169, and the 200-day EMA at $1.362.
The alignment of these longer-term EMAs above the market reinforces a capped structure. At the same time, the RSI at 36 hovers below the midline and the MACD remains negative, together hinting at lingering downside pressure rather than a decisive recovery.
On the downside, immediate support is located at the horizontal level near $1.0000, where buyers could attempt to slow the current slide.
On the topside, the first resistance is the 50-day EMA at $1.087, followed by the 100-day EMA at $1.169 and the prior horizontal barrier at $1.300, with the 200-day EMA at $1.362 and the more distant resistance at $1.900 marking deeper recovery checkpoints if bulls manage to reclaim the short-term averages.
(The technical analysis of this story was written with the help of an AI tool. Know more.)
Nothing in this material constitutes investment advice, personal recommendation, investment research, an offer, or a solicitation to buy or sell any financial instrument. The content has been prepared without consideration of your individual investment objectives, financial situation, or needs, and should not be treated as such.
Past performance is not a reliable indicator of future performance and/or results. Forward-looking scenarios or forecasts are not a guarantee of future performance. Actual results may differ materially from those anticipated.
Mitrade makes no representation or warranty as to the accuracy or completeness of the information provided and accepts no liability for any loss arising from reliance on such information.
Recommended Articles


