


CFDs are complex instruments and come with a high risk of losing money rapidly due to leverage. 80% of retail investor accounts lose money when trading CFDs with this provider. You should consider whether you understand how CFDs work and whether you can afford to take the high risk of losing your money.

Bitcoin SV Price Forecast: BSV hits three-month high, eyeing 200-day EMA breakout

Source Fxstreet
  • Bitcoin SV extends gains on Friday, testing the bullish breakout of the 200-day EMA at $15.39.
  • Retail strength holds firm with BSV futures Open Interest rising 5% in 24 hours amid positive funding rates.
  • The technical outlook for BSV is bullish as upside momentum builds.

Bitcoin SV (BSV) is up nearly 2% on Friday, extending a steady upward trend over the last two weeks. Retail strength builds in BSV amid multiple vulnerabilities found in the Bitcoin ecosystem. Bitcoin SV’s technical outlook is bullish as the price tests an upside breakout above the 200-day Exponential Moving Average (EMA) at $15.39.

Is Bitcoin SV regaining its retail strength?

Bitcoin SV shows mild strength in near-term retail demand following the recent vulnerabilities found in the Bitcoin ecosystem, including the Coldcard wallet hack and roughly 8,000 issues found by Bitcoin Red Team, a volunteer group of developers, using the Kimi K3 AI model. 

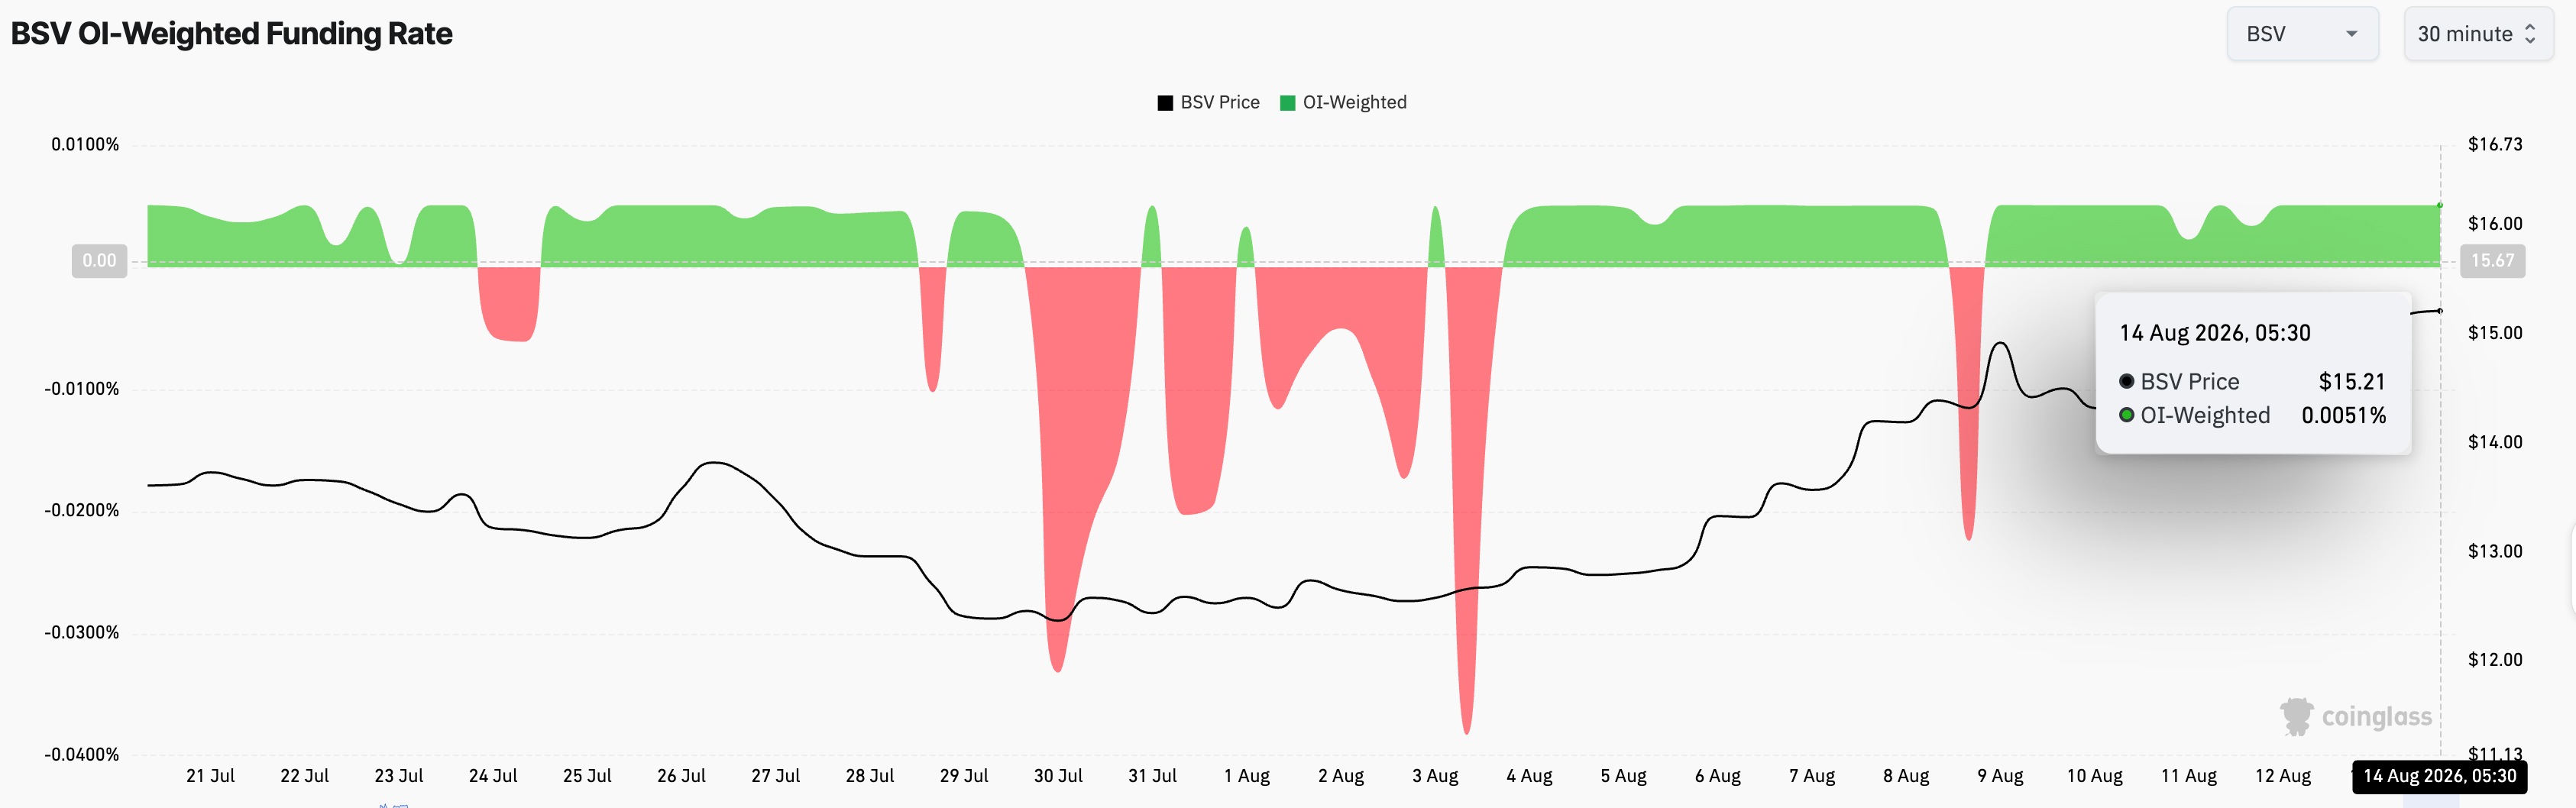
Buzz around the PiWalletSV, an air-gapped wallet for the Bitcoin SV ecosystem, adds to the retail strength. CoinGlass data shows the BSV futures Open Interest (OI) is at $38.54 million, up from $31.87 million on August 1, indicating a surge in positional buildup. At the same time, the funding rate holds stable at 0.0051%, reflecting a steady demand for long positions.
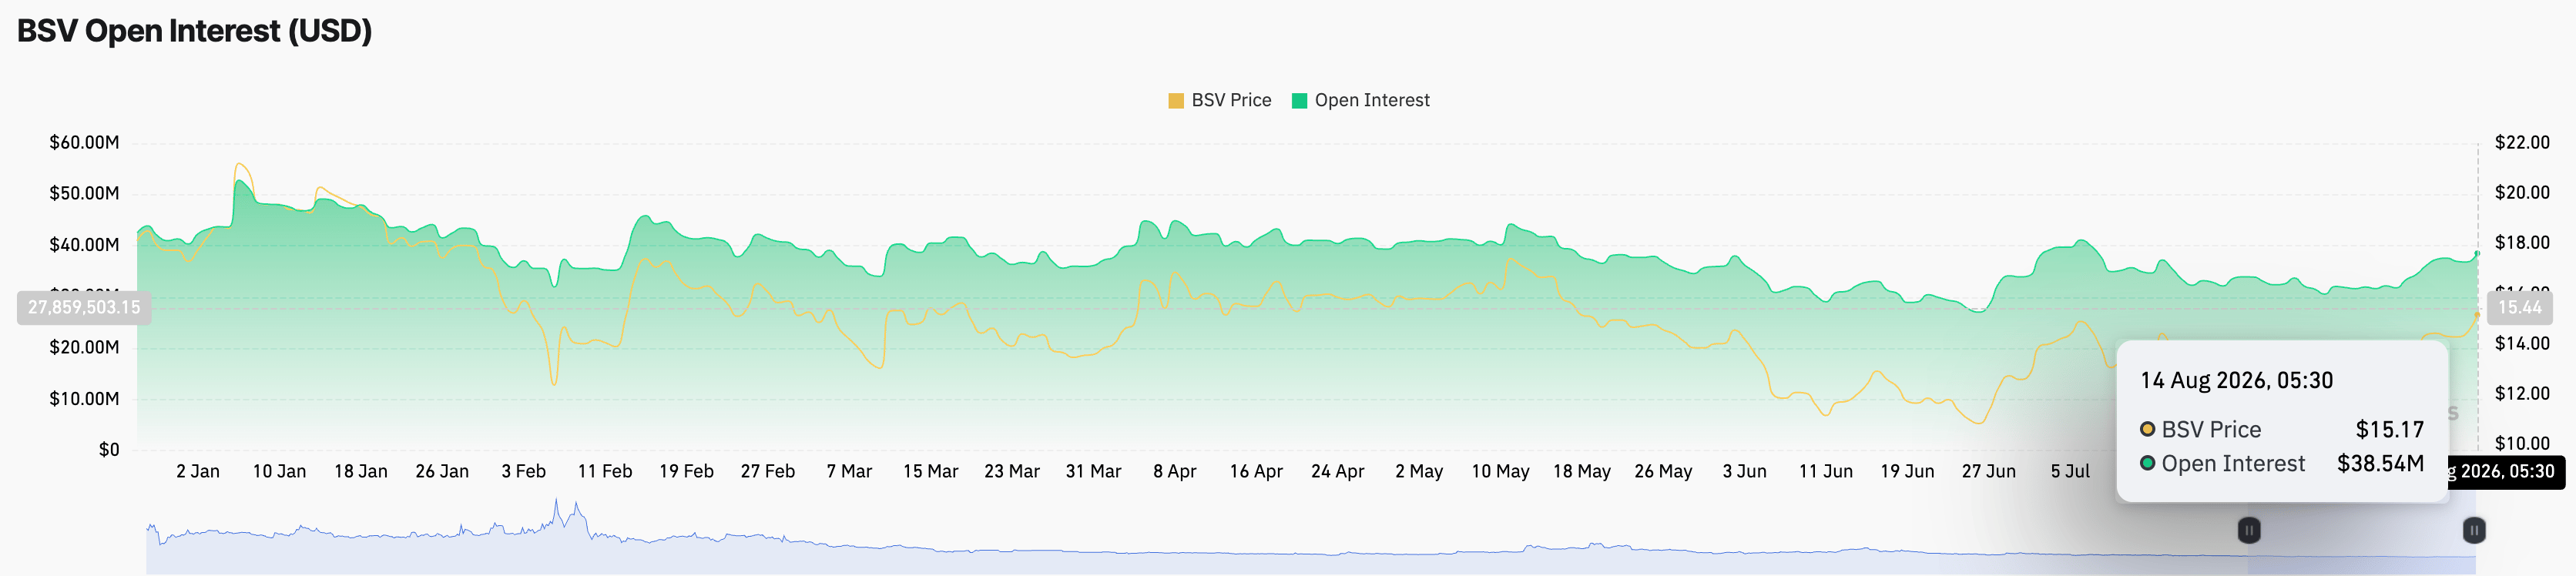
BSV Open Interest data. Source: CoinGlass
BSV funding rate data. Source: CoinGlass

Technical outlook: Will BSV price clear the 200-day EMA barrier?

Bitcoin SV trades at around $15.35 on Friday, holding a bullish near-term bias as price extends above the 50-day EMA at $13.57 while still capped just beneath the 200-day EMA at $15.39. From a technical perspective, the rebound in BSV from the $10.69 support level on June 25 suggests a possible trend reversal.

For a sustained recovery, BSV must clear the 200-day EMA at $15.39, followed by the $17.06 resistance marked by the December 28 low, which capped gains multiple times earlier this year.

The Moving Average Convergence Divergence (MACD) and its signal line rise into positive territory on the daily chart, hinting at positive momentum. At the same time, the Relative Strength Index (RSI) at 73 signals overbought conditions that could slow further upside movement.

BSV/USDT daily price chart.

On the downside, initial support is seen at the 50-day EMA at $13.57, where a pullback would still leave the broader recovery structure intact. However, a bearish breakout could threaten the $10.69 support level.

(The technical analysis of this story was written with the help of an AI tool. Know more.)

Disclaimer: The content available on Mitrade Insights is provided for informational and marketing purposes only. It has not been prepared in accordance with legal requirements designed to promote the independence of investment research and is not subject to any prohibition on dealing ahead of the dissemination of investment research
Nothing in this material constitutes investment advice, personal recommendation, investment research, an offer, or a solicitation to buy or sell any financial instrument. The content has been prepared without consideration of your individual investment objectives, financial situation, or needs, and should not be treated as such.
Past performance is not a reliable indicator of future performance and/or results. Forward-looking scenarios or forecasts are not a guarantee of future performance. Actual results may differ materially from those anticipated.
Mitrade makes no representation or warranty as to the accuracy or completeness of the information provided and accepts no liability for any loss arising from reliance on such information.
placeholder
Pi Network Price Annual Forecast: PI set for rocky 2026 as community eyes real-world utilityPi Network (PI) crashed by over 90% in 2025 from its all-time high of $3.00, with minor recovery along the way. The downfall was fueled by low investor confidence as mainnet migrations increased token deposits on Know Your Business (KYB) verified exchanges. 
Author  FXStreet
Dec 19, 2025
Pi Network (PI) crashed by over 90% in 2025 from its all-time high of $3.00, with minor recovery along the way. The downfall was fueled by low investor confidence as mainnet migrations increased token deposits on Know Your Business (KYB) verified exchanges. 
placeholder
Financial Markets 2026: Volatility Catalysts in Gold, Silver, Oil, and Blue-Chip Stocks—A CFD Trader's OutlookThe financial world is perpetually in motion, but the landscape for 2026 seems to be shaping up to be particularly dynamic. For CFD traders navigating global markets, this heightened volatility could present a distinctive set of challenges and opportunities.
Author  Rachel Weiss
May 18, Mon
The financial world is perpetually in motion, but the landscape for 2026 seems to be shaping up to be particularly dynamic. For CFD traders navigating global markets, this heightened volatility could present a distinctive set of challenges and opportunities.
placeholder
Silver Price Forecast: XAG/USD bulls seem hesitant below $82.00; US NFP awaitedSilver (XAG/USD) steadies following the previous day's modest pullback from the $84.00 mark and trades with a mild positive bias during the Asian session on Wednesday.
Author  FXStreet
Feb 11, Wed
Silver (XAG/USD) steadies following the previous day's modest pullback from the $84.00 mark and trades with a mild positive bias during the Asian session on Wednesday.
placeholder
Euro zone short-dated yields set for weekly rise on Hormuz concernsBy Stefano Rebaudo April 24 (Reuters) - Euro zone short-dated government bond yields were headed for their biggest weekly rise in over a month as tensions around the Strait of Hormuz stoked inflation fears and European Central Bank rate hike expectations.Borrowing costs tracked oil prices, which ...
Author  Reuters
Apr 24, Fri
By Stefano Rebaudo April 24 (Reuters) - Euro zone short-dated government bond yields were headed for their biggest weekly rise in over a month as tensions around the Strait of Hormuz stoked inflation fears and European Central Bank rate hike expectations.Borrowing costs tracked oil prices, which ...
placeholder
The Trumponomics Ebook: Oil Price Volatility in the Iran War Understand how the Strait of Hormuz shock moved markets, and what CFD traders watched next.
Author  Rachel Weiss
May 25, Mon
Understand how the Strait of Hormuz shock moved markets, and what CFD traders watched next.
Related Instrument
goTop
quote