



Oracle Stock Price Forecast: AI Data Center Delays Exacerbate Debt Pressure, What Risks Does ORCL Face?
TradingKey - Oracle (ORCL)'s AI infrastructure expansion is facing a new test. As multiple large data center projects encounter power supply bottlenecks, the cloud computing revenue the company had hoped to quickly monetize may be forced to be delayed, while upfront financing costs and debt repayment pressures will not disappear as a result.
Morgan Stanley noted in its latest credit analysis that data center delays could slow the pace of Oracle's revenue recognition and cash recovery, while concentrating part of its financing needs around 2028. If project timelines deviate significantly from original plans, the company may need to commit more capital in the short term to complete facility construction and equipment deployment, further complicating cash management.
Power supply is currently one of the main obstacles facing project progress.
Oracle's Lighthouse data center project in Wisconsin has been impacted by the pace of power approval. Morgan Stanley expects the project's actual power supply delivery date could be pushed back to mid-2028, later than the previously expected second half of 2027.
The Jupiter project in New Mexico is also facing energy supply issues. Oracle is evaluating an alternative solution of trucking compressed natural gas, but the cost of this method could be several times that of pipeline transportation, adding to the project's subsequent operational burden.
Project delays could affect the monetization of Oracle's massive contract backlog. The company currently holds approximately $638 billion in remaining performance obligations (RPO), which represents contracted revenue that has not yet been recognized.
Meanwhile, credit markets have shown noteworthy signals. On October 8, Oracle's five-year credit default swap (CDS) closed at 261 basis points, hitting a record high. An increase in CDS prices means that the market is paying higher costs to hedge against the company's potential credit risks.
In addition, Oracle's long-term bond prices are under pressure, and its financing costs face upward pressure. Although the company still maintains an investment-grade credit rating, investors are evaluating more cautiously whether its AI investments can generate revenue as expected, as well as the impact of heavy capital expenditures on its balance sheet.
Oracle Stock Price Technical Analysis
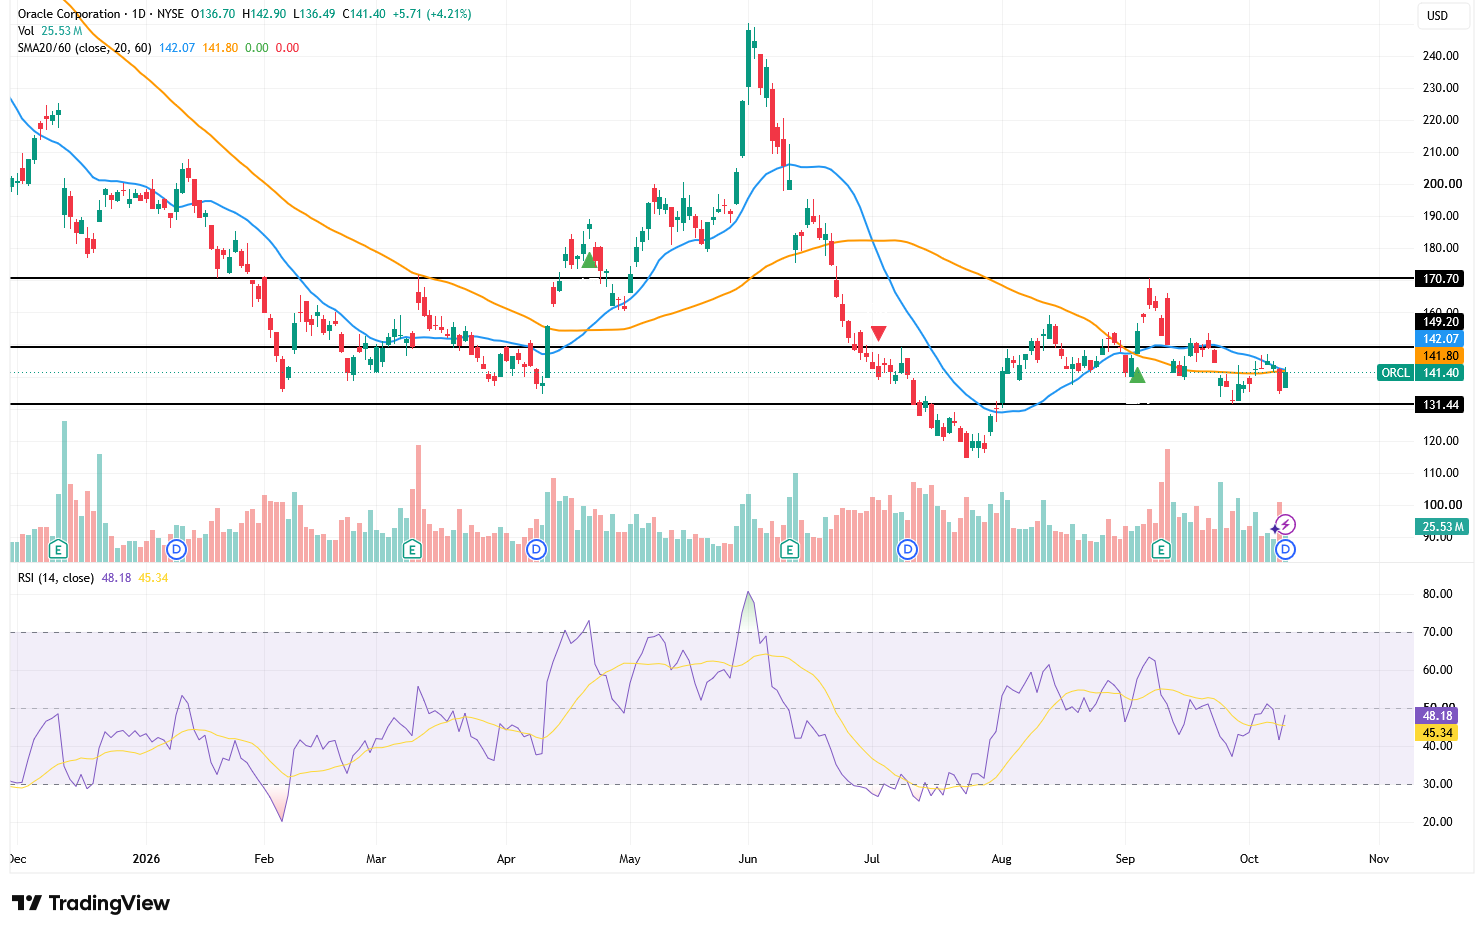
Source: TradingView
On the daily chart, Oracle's stock price rose 4.21% in its latest session to close at $141.40, but remains slightly below its 20-day moving average of $142.07 and 60-day moving average of $141.80. The two moving averages have converged significantly, indicating that bullish and bearish forces are reaching equilibrium; if the 20-day moving average breaks below the 60-day moving average, it will form a bearish signal, potentially further weighing on market sentiment.
Since surging to around $168 in early September, ORCL has continued to form lower rebound highs, and its short-term downward structure has not yet fully reversed. Currently, $142–$145 forms the first resistance zone; only if the stock price firmly stays above $145 on heavy volume will it have the opportunity to further challenge $150–$152, with a potential target of $158–$160 following a breakout.
To the downside, attention should first be focused on the $136–$138 support zone. If the stock price falls below $136, it may further retest $130–$133; once this area is lost, the downside target will point to $125, and under extreme circumstances, a retest of the July low of $116–$120 cannot be ruled out.
The RSI currently stands at 48.18. Although it is above the smoothed signal line of 45.34, indicating a short-term recovery in momentum, it has not yet climbed above 50, which is temporarily insufficient to confirm a trend reversal. Volume has not expanded significantly either, suggesting that buying confidence remains limited.
Nothing in this material constitutes investment advice, personal recommendation, investment research, an offer, or a solicitation to buy or sell any financial instrument. The content has been prepared without consideration of your individual investment objectives, financial situation, or needs, and should not be treated as such.
Past performance is not a reliable indicator of future performance and/or results. Forward-looking scenarios or forecasts are not a guarantee of future performance. Actual results may differ materially from those anticipated.
Mitrade makes no representation or warranty as to the accuracy or completeness of the information provided and accepts no liability for any loss arising from reliance on such information.
Recommended Articles


