



CoreWeave Stock Price Forecast: Plunges Over 15% to Lowest Since Late July as DA Davidson Warns High Financing Costs Could Cause Total Loss for Shareholders
TradingKey - On October 14, US Eastern Time, CoreWeave (CRWV) saw its stock price plummet over 15%, hitting a new low since late July.
D.A. Davidson analyst Gil Luria said on the Prof G Markets podcast that once the AI investment boom cools down, high borrowing costs could prevent the AI cloud service provider from meeting its debt obligations, potentially causing shareholders to suffer a total loss.
Luria remains bullish on AI demand, but questioned CoreWeave's return on investment. He stated that the company's borrowing cost is around 9%, while its estimated return on investment is only about 1%; even if it reaches the company's target of 4% to 5% as he noted, it would still fall short of its financing costs. He compared it to borrowing money at 9% to buy U.S. Treasuries yielding 5%.
CoreWeave is currently seeking to bring in insurance capital to lower its financing costs. According to an interview with the Financial Times, co-founder Brannin McBee hopes to obtain investment-grade ratings for more chip-collateralized debt to attract insurance capital and reduce financing costs. An $8.5 billion loan completed by the company earlier this year, backed by long-term computing power purchase contracts with Meta, was its first chip-collateralized loan to receive a full investment-grade rating. However, McBee admitted that loans supported by customer contracts from non-investment-grade AI labs have not yet met the entry standards for insurance capital.
In addition, as of the end of June, CoreWeave's debt and lease obligations stood at approximately $52 billion, while second-quarter interest expenses nearly doubled year-over-year to $640 million, bringing its debt level to about 5.8 times its annualized EBITDA. S&P assessed its financial risk as "aggressive".
Jordan Chalfin, an analyst at CreditSights, pointed out that yields on CoreWeave's unsecured bonds have risen to nearly 15%, as investors worry about a maturity mismatch between its long-term data center leases and shorter-term customer contracts.
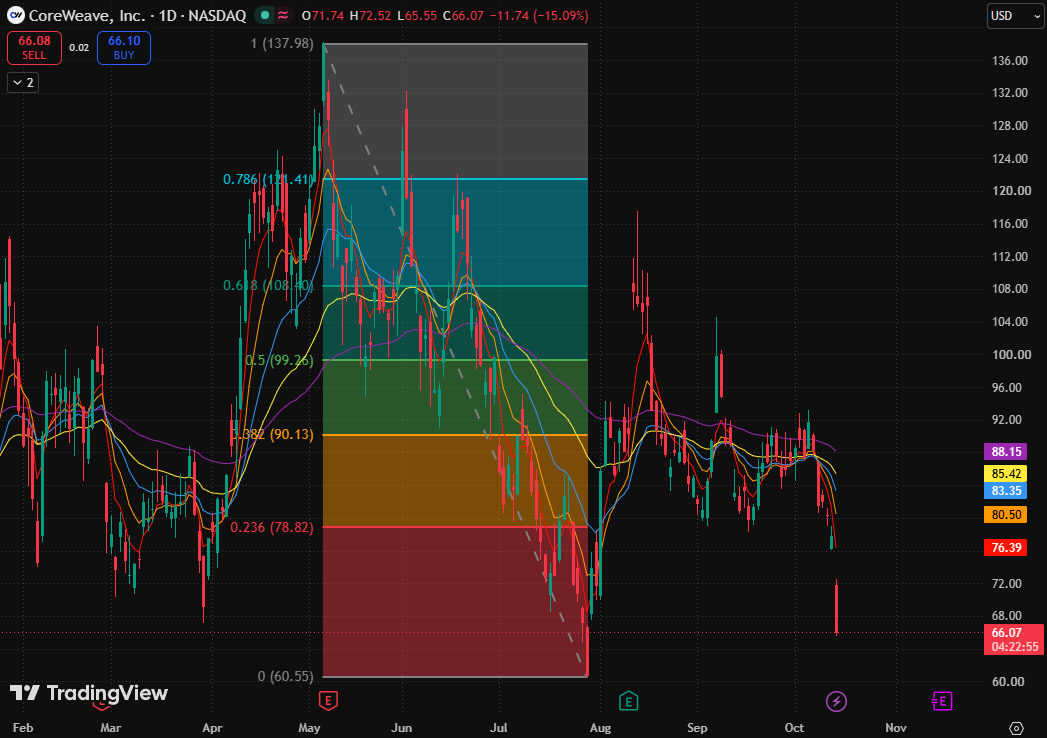
CoreWeave daily chart, Source: TradingView
Looking at CoreWeave's stock chart, the price is currently approaching its previous low of $60.55 from late July. It is currently in a gap-down accelerated decline within a downtrend, testing near the previous low. The price remains close to intraday lows, with no clear recovery from the drop yet.
From a Fibonacci perspective, after losing the 0.236 Fibonacci retracement level ($78.82), the stock price has entered the bottom area of the entire measured range, giving back most of its previous gains. The key here is not whether the decline is large enough, but whether the previous low can provide effective support.
Regarding moving averages, the 5-day, 10-day, 20-day, 80-day, and 160-day moving averages stand at $76.39, $80.50, $83.35, $85.42, and $88.15, respectively. The shorter-term moving averages are sequentially below the longer-term ones, forming a complete bearish alignment; the price also remains below all moving averages, indicating weak trend and positioning.
Looking ahead for the stock price, a short-term recovery will only be grounded if the stock holds above the previous low and reclaims the post-gap intraday high to form a double bottom. If the stock price convincingly breaks below the previous low, it will imply a further extension of the downward structure.
Nothing in this material constitutes investment advice, personal recommendation, investment research, an offer, or a solicitation to buy or sell any financial instrument. The content has been prepared without consideration of your individual investment objectives, financial situation, or needs, and should not be treated as such.
Past performance is not a reliable indicator of future performance and/or results. Forward-looking scenarios or forecasts are not a guarantee of future performance. Actual results may differ materially from those anticipated.
Mitrade makes no representation or warranty as to the accuracy or completeness of the information provided and accepts no liability for any loss arising from reliance on such information.
Recommended Articles


