



Microsoft Stock Forecast: MSFT Jumps 4% Overnight as Azure Hits 48% and Cash Flow Doubles Estimates
TradingKey - Microsoft (NASDAQ: MSFT) jumped to $552.30 in overnight trading, up about 4%, after its fiscal first-quarter report beat estimates on Wednesday, October 28. The stock had closed the regular session nearly flat at $531.01, so the move takes it above $546.35 resistance and close to its $555.45 record high from July 2025.
The reaction was the opposite of Alphabet's, which fell about 10% after hours the same evening. Both companies are spending heavily on AI, but Microsoft grew Azure 48% and still produced $18.6 billion of free cash flow, the cash left after capital spending. Alphabet burned $9.1 billion.
Fiscal Q1 Beat on Every Main Line
Revenue rose 19% to $92.28 billion, above the roughly $90.6 billion analysts expected. Adjusted EPS, which leaves out gains and losses from its OpenAI stake, rose 18% to $4.89, beating the $4.73 estimate. GAAP EPS was $4.92, and operating income rose 21% to $45.9 billion.
Microsoft Cloud revenue grew 30% to $63.9 billion, and the Agents and Infra segment, Microsoft's new main reporting group, earned $40.6 billion in operating income, up 24%. The weak spot was Devices and Consumer, where revenue fell 3% and Windows OEM and devices revenue, from Windows licenses sold to PC makers and Microsoft's own hardware, dropped 22%.
Azure Beat Its Own Guide
Azure revenue rose 48% to $33.2 billion, ahead of the roughly 45% growth Microsoft guided in July. It did that even though some capacity did not arrive on time. CFO Amy Hood said "some third-party capacity deliveries we expected in Q1 were delayed," referring to outside providers that supply Microsoft with extra computing power.
Capex Came In Lower Because Capacity Was Late
Capex, the money spent on data centers and equipment, was $45.2 billion including finance leases, long-term data center leases. That was up about 30% but below the $50.7 billion StreetAccount estimate and Microsoft's own target of about $50 billion. Hood said calendar 2026 spending should now be about $170 billion because of those delays, down from about $175 billion. She expects Q2 capex above $50 billion and faster spending in the second half of the fiscal year, including higher memory and storage costs.
The delays hit neocloud stocks, the smaller AI cloud providers, after hours. CoreWeave fell 5.8% and Nebius 6.3%.
Free Cash Flow Is the Big Difference
Free cash flow of $18.6 billion was more than double the roughly $8.5 billion estimate. Hood said "we expect to continue to remain free cash flow positive in FY27," adding that Microsoft "will access additional sources of funding, when we believe it is attractive to do so." That sets it apart from Meta, which priced $37.5 billion of new stock and preferred shares on October 27, and Alphabet, which sold $12.4 billion of shares in Q3.
Part of the cash beat is timing, though. Spending that slipped out of Q1 moves into later quarters, so free cash flow is likely to face more pressure in the second half.
Q2 Guidance Tops Consensus
Microsoft guided Q2 revenue to $96.0 billion to $97.1 billion, above the roughly $95.6 billion consensus. It expects Azure growth of 49% to 50% at constant currency, which strips out exchange-rate moves, above the roughly 47.6% analysts expected.
One number did not move. Commercial remaining performance obligation, contracted revenue not yet booked, was $677 billion, up 73% from a year earlier but flat from $678 billion in July.
What to Watch Next
Amazon reports after the close on Thursday, October 29, completing the big cloud reports for the week. For Microsoft, the next tests are whether Q2 capex tops $50 billion and whether the delayed capacity arrives in the second half.
Microsoft Technical Analysis: Daily Close Above $546.35 Could Open $572.41
The overnight jump takes MSFT straight to the key level on the daily chart. MSFT has risen inside a channel, two parallel lines that contain a trend, since August, and it trades above both moving averages, which track the average price over a set period. The $552.30 overnight price is above $546.35, a ceiling that has stopped rallies three times since last year, but the break only counts once a session closes above it.
RSI, a momentum gauge that runs from 0 to 100, is near 56, so momentum is healthy and has room to rise before 70, the usual overbought line.
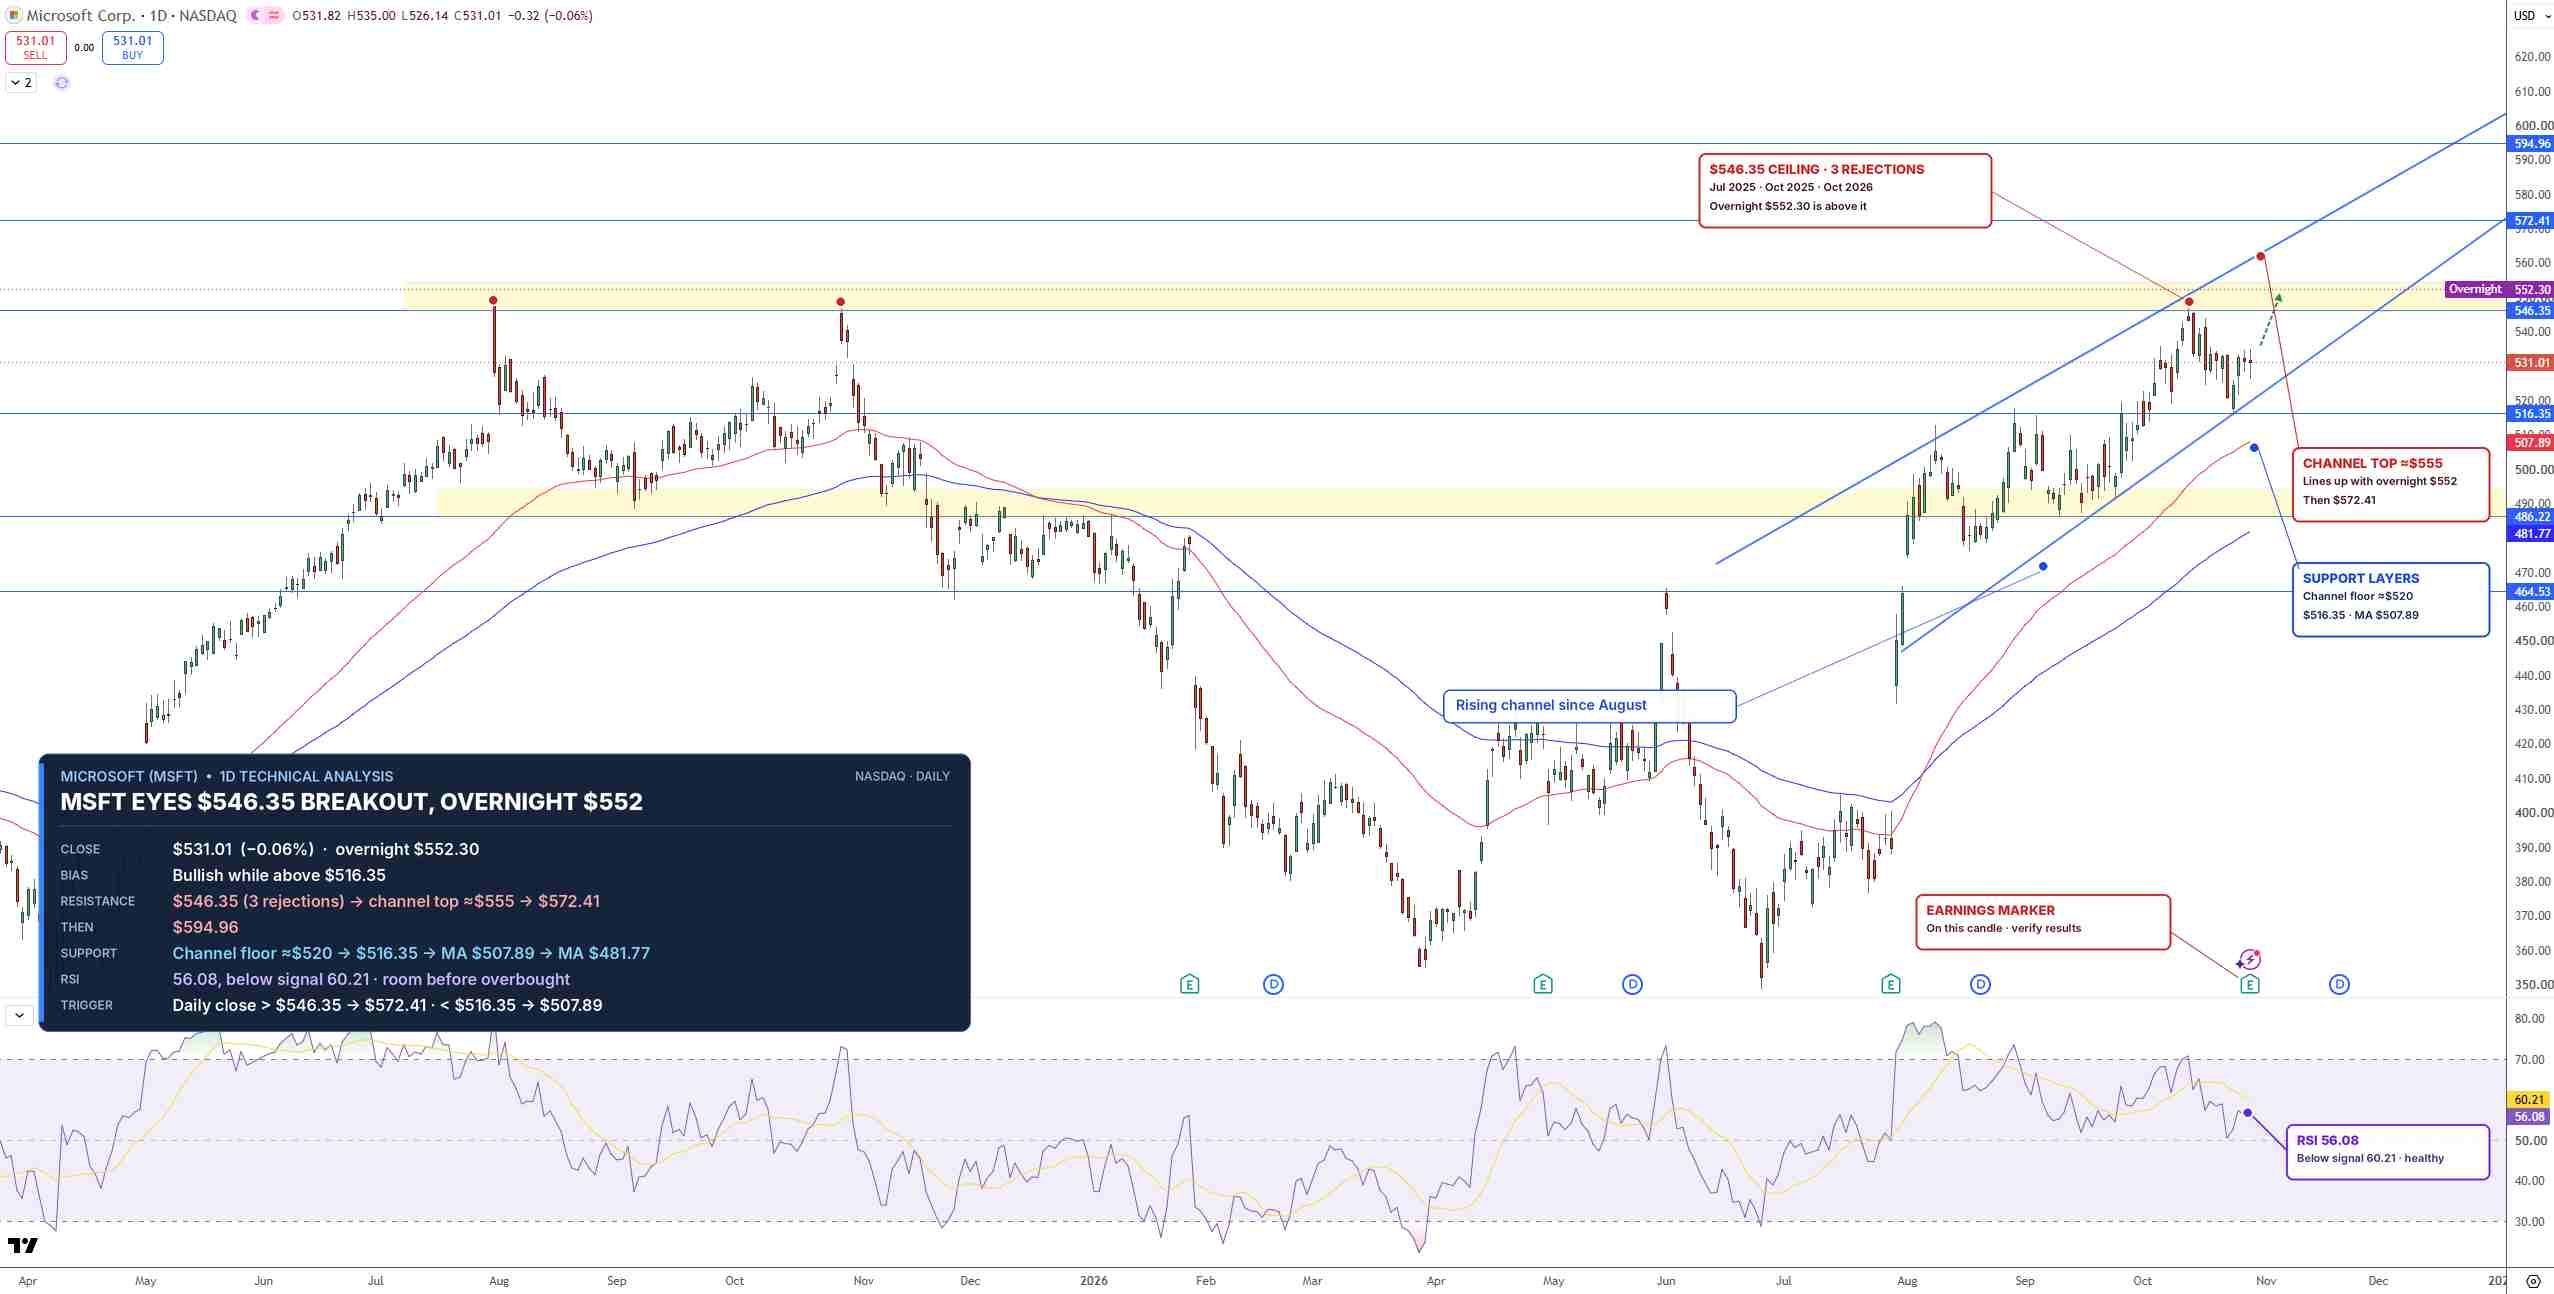
MSFT Price Chart - Source: Tradingview
If the gain holds, a daily close above $546.35 would confirm the breakout and open the way for $572.41, then $594.96. On the downside, $516.35 is key support. A close below it would push the price toward the $507.89 moving average.
I'm bullish while MSFT holds above $516.35, and a daily close above $546.35 would target $572.41.
Key Levels
- Last close: $531.01, down 0.06% on October 28 ($552.30 overnight)
- Support: $516.35, $507.89, $481.77
- Resistance: $546.35, $572.41, $594.96
- RSI: 56.08, below the 70 overbought line
- Bullish trigger: Daily close above $546.35
- Bearish trigger: Daily close below $516.35
FAQs
Why is Microsoft stock up after earnings?
Microsoft rose about 4% overnight after revenue, EPS and Azure growth beat estimates, free cash flow of $18.6 billion more than doubled forecasts and Q2 guidance topped consensus.
What is the Microsoft stock forecast now?
The bias is bullish above $516.35. A daily close above $546.35 targets $572.41 and $594.96, while a close below $516.35 opens $507.89.
Bottom Line
Microsoft grew Azure faster and still produced cash, the test Alphabet failed the same night. The level that matters is $546.35, which has capped the stock three times. In my view, a daily close above it confirms the breakout, though delayed capex means the cash picture will be tested again in the second half.
Nothing in this material constitutes investment advice, personal recommendation, investment research, an offer, or a solicitation to buy or sell any financial instrument. The content has been prepared without consideration of your individual investment objectives, financial situation, or needs, and should not be treated as such.
Past performance is not a reliable indicator of future performance and/or results. Forward-looking scenarios or forecasts are not a guarantee of future performance. Actual results may differ materially from those anticipated.
Mitrade makes no representation or warranty as to the accuracy or completeness of the information provided and accepts no liability for any loss arising from reliance on such information.
Recommended Articles


