

Solana (SOLUSD) Is up 2.28% on Jun 21: What Are the Risk Factors?
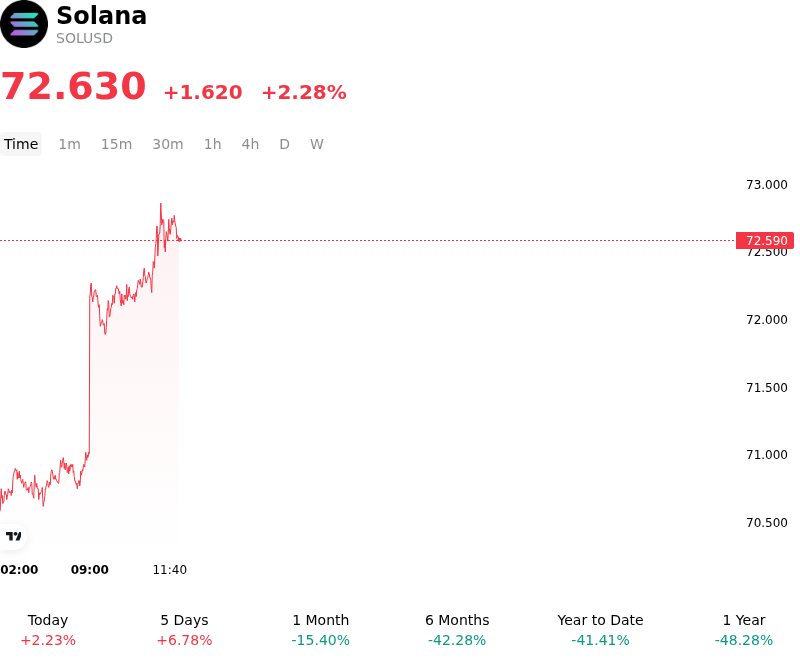
Solana (SOLUSD) is up 2.28% at Jun 21 00:00(ET), now at $72.63, with a 7-day up of 7.58%.
What is driving Solana (SOLUSD)’s stock price up today?
The primary catalyst driving the positive price action in Solana is the significant progress in institutional product development, highlighted by Morgan Stanley's updated regulatory filings for a spot Solana exchange-traded fund (ETF). The submission of its second-amended S-1 registration statement, which revealed a market-low annual sponsor fee of 0.14% and integrated institutional-grade staking mechanics using prominent industry providers, has dramatically improved market sentiment. This concrete progress in active regulatory dialogue with the Securities and Exchange Commission signals that traditional finance is actively preparing low-cost, yield-bearing investment vehicles for the asset, attracting substantial institutional interest and improving long-term adoption expectations.
On-chain developments and structural upgrades to the blockchain have further bolstered investor confidence. The activation of the SIMD-0490 protocol update mandates a minimum delegation of 1 SOL for all new staking accounts, directly addressing historical concerns over network efficiency and transaction stability. By preventing the creation of spam-like, minimally funded accounts, this upgrade reduces database bloat and minimizes transaction failures at the consensus layer. This fundamental optimization, combined with emerging middleware solutions designed to streamline transaction processing, reinforces Solana's technical competitive advantage as a highly scalable, enterprise-grade layer-1 network.
This upward momentum also reflects a broader capital recovery following the market-wide correction during late May and early June, where the asset established a firm technical floor around the psychologically significant support zone near sixty dollars. The bounce from these lows has been supported by resilient ecosystem health, as evidenced by sustained daily active user metrics, substantial transaction volumes, and stablecoin liquidity remaining above fifteen billion dollars. Furthermore, digital asset fund flow data indicates a reversal of recent outflows, with Solana-focused investment products attracting fresh capital inflows, signaling that institutional investors are actively accumulating the asset at discount levels relative to its mid-quarter peaks.
While the current trajectory is highly constructive, investors remain mindful of several structural risks. The timeline for a final SEC decision on spot Solana ETFs remains uncertain, and any potential regulatory delays could lead to a rapid repricing of the asset's premium. Additionally, although protocol upgrades are actively addressing network bottlenecks, the platform must demonstrate continued operational stability under high-load conditions to fully cement its institutional narrative. Nevertheless, the confluence of competitive institutional ETF filings, structural staking enhancements, and stabilizing capital flows has provided strong fundamental support for the asset's recovery.
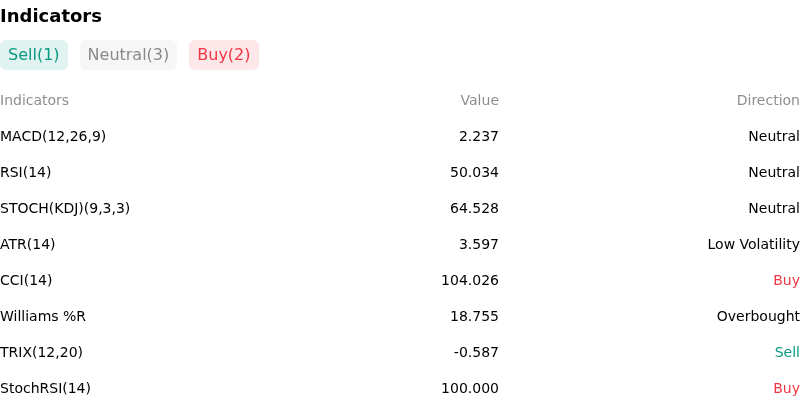
Technical Analysis of Solana (SOLUSD)
Technically, Solana (SOLUSD) shows a MACD (12,26,9) value of 2.247, indicating a neutral signal. The RSI at 50.171 suggests neutral condition and the Williams %R at 18.140 suggests overbought condition. Please monitor closely.
More details about Solana (SOLUSD)
Recent Events and Risks:
- Severe Bearish Technical Structure and Downside Liquidation Risks: SOL has failed to reclaim its critical $75–$76 resistance zone, sliding down toward $71 after the Federal Reserve projected potential further rate hikes. Pinned below its 20-day and 50-day EMAs, the market remains exposed to major liquidation clusters; a decisive break below immediate support near $68–$70 risks a cascade toward the 2.5-year low of $60.12.
- Institutional Capital Flight and Regulatory Ambiguity: High-profile capital flight, highlighted by Goldman Sachs completely liquidating its $108 million spot Solana ETF and trust holdings, continues to damp institutional sentiment. This sell-off is aggravated by ongoing compliance anxiety, as Solana still lacks the statutory commodity classification that other assets are seeking through legislative vehicles like the CLARITY Act.
- Persistent Supply-Side Sell Pressure: The spot market remains fragile following aggressive treasury offloading, notably from the meme-coin deployer Pump.fun, which recently dumped over 100,000 SOL (~$8.5 million). This spot pressure is compounded by the market digesting a scheduled unlock of 624,666 SOL tokens, making it difficult for the order book to absorb sell orders.
- Speculative Cooling and Network Volume Decay: Solana's core network activity is experiencing a sharp contraction, characterized by an 80% plunge in weekly speculative meme-coin volumes. This decay in transaction utility, combined with the crypto Fear & Greed Index hitting an extreme low of 15, indicates deep market capitulation and a broad rotation out of high-beta altcoins.
Nothing in this material constitutes investment advice, personal recommendation, investment research, an offer, or a solicitation to buy or sell any financial instrument. The content has been prepared without consideration of your individual investment objectives, financial situation, or needs, and should not be treated as such.
Past performance is not a reliable indicator of future performance and/or results. Forward-looking scenarios or forecasts are not a guarantee of future performance. Actual results may differ materially from those anticipated.
Mitrade makes no representation or warranty as to the accuracy or completeness of the information provided and accepts no liability for any loss arising from reliance on such information.
Recommended Articles


