



Walmart Inc Stock (WMT) Moved Up by 3.63% on Jul 28: What Investors Need To Know
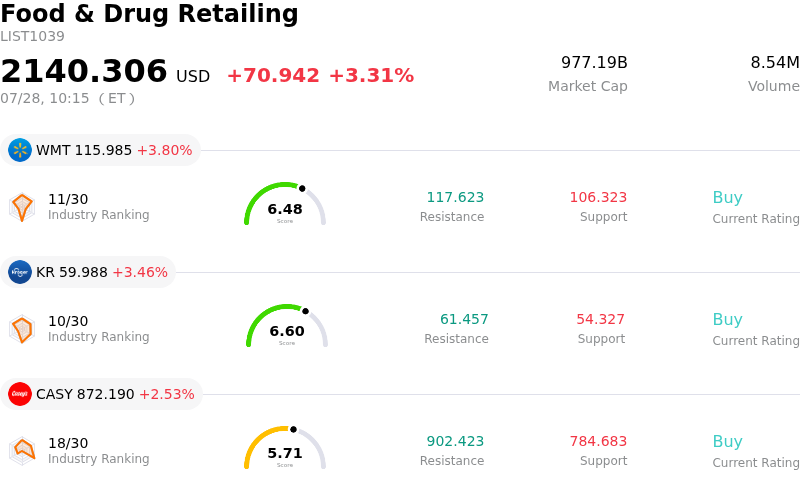
Walmart Inc (WMT) moved up by 3.63%. The Food & Drug Retailing sector is up by 3.31%. The company outperformed the industry. Top 3 stocks by turnover in the sector: Walmart Inc (WMT) up 3.63%; Kroger Co (KR) up 3.46%; Caseys General Stores Inc (CASY) up 2.53%.
What is driving Walmart Inc (WMT)’s stock price up today?
Walmart’s recent performance reflects a robust alignment of operational efficiency and strategic pivots that have resonated strongly with institutional investors. A primary catalyst for the upward momentum is the significant margin expansion observed in the company’s e-commerce segment. By leveraging its vast physical footprint as fulfillment centers and integrating advanced automation across its distribution network, the retailer has managed to substantially lower the per-order delivery cost. This transformation from a traditional brick-and-mortar giant into a technologically proficient omnichannel leader is increasingly viewed as a long-term moat by market participants.
Beyond logistics, the rapid growth of the company’s high-margin diversified revenue streams, particularly its retail media business, has provided a significant tailwind. As brand advertisers shift budgets toward platforms with direct purchase data, Walmart Connect has emerged as a high-growth engine that offsets the thinner margins associated with grocery and general merchandise. This diversification reduces the company’s sensitivity to fluctuations in consumer discretionary spending, making it an attractive pick for those seeking both growth and stability in a shifting macroeconomic landscape.
Market sentiment has also been bolstered by the retailer’s continued success in capturing market share among higher-income demographics. In an environment where value remains a top priority for households, the company’s price leadership has drawn in consumers who traditionally shopped at more upscale competitors. This shift is not merely cyclical; the stickiness of the Walmart+ subscription service suggests that these new customer segments are being integrated into the company’s ecosystem for the long term, enhancing the predictability of future cash flows.
Institutional portfolio adjustments have likely played a role in the observed volatility and subsequent price appreciation. As analysts revise their earnings forecasts upward based on improved guidance, many large-cap funds are rebalancing their consumer staples allocations to favor companies with proven technological advantages. The combination of cooling supply chain pressures and the company’s disciplined inventory management has led to a leaner balance sheet, further strengthening the bull case among fundamental analysts.
While geopolitical risks and currency fluctuations remain a backdrop for any global entity, the domestic dominance of the company provides a protective buffer. The current trajectory suggests that the market is rewarding the company’s ability to maintain top-line growth while aggressively optimizing its cost structure through AI and robotics. This sentiment is reflected in the sustained buying pressure observed throughout the session, as the stock attracts interest from both defensive-minded investors and those looking for tech-enabled retail innovation.
Technical Analysis of Walmart Inc (WMT)
Technically, Walmart Inc (WMT) shows a MACD (12,26,9) value of 0.053, indicating a neutral signal. The RSI at 44.988 suggests neutral condition and the Williams %R at 56.195 suggests sell condition. Please monitor closely.
Fundamental Analysis of Walmart Inc (WMT)
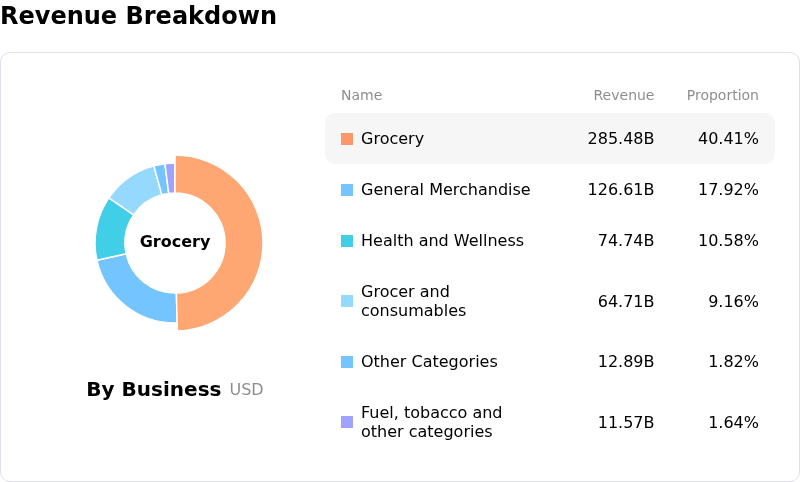
Walmart Inc (WMT) is in the Food & Drug Retailing industry. Its latest annual revenue is $713.16B, ranking 1 in the industry. The net profit is $21.89B, ranking 1 in the industry. Company Profile
Over the past month, multiple analysts have rated the company as Buy, with an average price target of $138.16, a high of $155.00, and a low of $72.45.
More details about Walmart Inc (WMT)
Company Specific Risks:
- Margin Erosion via Consumer Mix Shift: Analysts have expressed immediate concern over the accelerating transition of consumer spend from high-margin discretionary categories (electronics and apparel) toward low-margin essential consumables and groceries, threatening the overall gross margin profile for the upcoming quarter.
- Heightened Capital Expenditure Volatility: Recent updates regarding the massive scale of supply chain automation and AI-driven fulfillment center upgrades have triggered investor anxiety regarding near-term free cash flow suppression and potential integration delays that could disrupt peak season logistics.
- Persistence of Inventory Shrinkage: Ongoing reports of elevated retail theft and "shrink" in key urban markets continue to serve as a significant headwind to operating income, forcing a re-evaluation of store-level profitability and higher-than-expected spending on security infrastructure.
- E-commerce Profitability Hurdles: Despite robust top-line growth in the digital segment, the high costs associated with last-mile delivery and the aggressive expansion of the Walmart+ ecosystem are facing scrutiny for their continued drag on the company's consolidated operating margins relative to brick-and-mortar performance.
Nothing in this material constitutes investment advice, personal recommendation, investment research, an offer, or a solicitation to buy or sell any financial instrument. The content has been prepared without consideration of your individual investment objectives, financial situation, or needs, and should not be treated as such.
Past performance is not a reliable indicator of future performance and/or results. Forward-looking scenarios or forecasts are not a guarantee of future performance. Actual results may differ materially from those anticipated.
Mitrade makes no representation or warranty as to the accuracy or completeness of the information provided and accepts no liability for any loss arising from reliance on such information.
Recommended Articles


