



Solana (SOLUSD) Is down 1.18% on Aug 24: Key Drivers to Watch
Solana (SOLUSD) is down 1.18% at Aug 24 00:05(ET), now at $92.96, with a 7-day up of 23.96%.
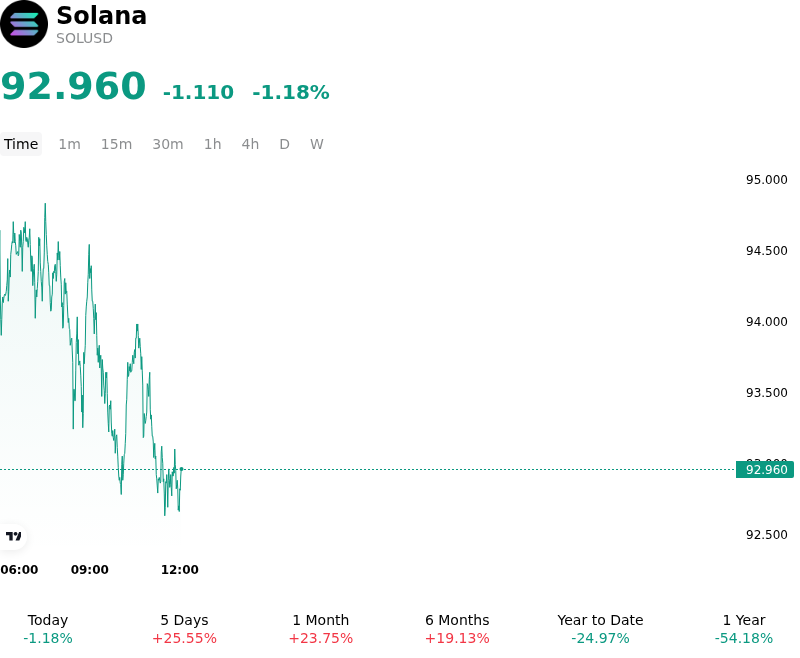
What is driving Solana (SOLUSD)’s stock price down today?
Solana pulled back during the trading session as market participants engaged in profit-taking following a sharp multi-day advance toward key technical resistance. The movement reflects a localized leverage flush and position adjustment across crypto derivatives markets, compounded by broader market consolidation after major digital assets paused near key psychological levels.
Macroeconomic drivers played a central role in shaping market liquidity and investor risk appetite. While recent shifts in U.S. Treasury debt buyback operations and easing long-end yields provided a supportive liquidity backdrop for digital assets, traders chose to reduce exposure to higher-beta smart contract platforms ahead of upcoming economic catalysts and policy signals. As the initial surge in broad risk sentiment digested previous capital inflows, institutional capital shifted into a temporary holding pattern, moderating short-term buying pressure for Layer-1 tokens.
On-chain indicators highlight an underlying divergence between short-term spot market pricing and longer-term ecosystem expansion. Solana continues to record fundamental growth across decentralized finance, tokenized real-world assets, and network participant metrics, driven by expanding institutional interest in tokenized Treasuries and decentralized trading venues. However, a pause in spot Solana ETF net inflows relative to prior sessions, combined with a temporary cooldown in speculative retail transaction activity, reduced immediate capital velocity across network protocols.
Derivatives positioning further amplified the intraday downside. Elevated futures open interest and stretched funding rates entering the session created a vulnerable positioning landscape, where minor spot selling triggered automated long liquidations near major technical pivot points. This derivative-driven friction accelerated downside price discovery before liquidity stabilized around key support zones.
Looking ahead, institutional investors view this pullback as a standard liquidity repricing and leverage reset rather than a structural deterioration in Solana's network thesis. Key risks under active monitoring include potential macroeconomic liquidity shifts, regulatory developments affecting smart contract platforms, and the trajectory of sustained institutional product inflows required to absorb overhead supply.
Technical Analysis of Solana (SOLUSD)
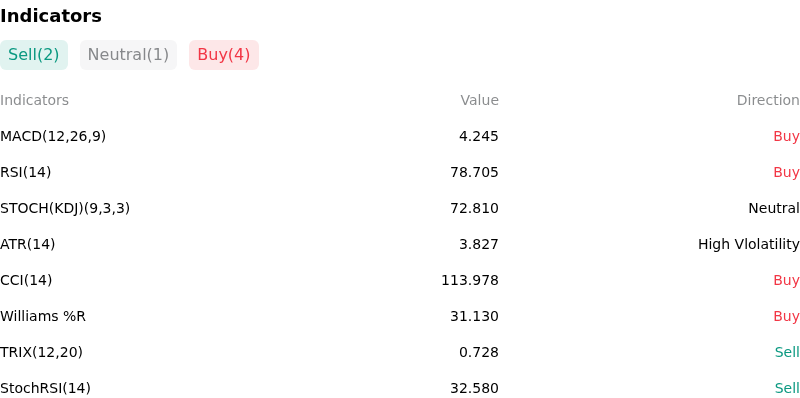
Technically, Solana (SOLUSD) shows a MACD (12,26,9) value of 4.254, indicating a buy signal. The RSI at 78.938 suggests buy condition and the Williams %R at 30.885 suggests buy condition. Please monitor closely.
More details about Solana (SOLUSD)
Recent Events and Risks:
- Technical Resistance Rejection and Leverage Unwinding: Following a rapid multi-session rally toward the $94–$96 resistance ceiling, SOL's short-term momentum indicators reached overbought territory, triggering automated profit-taking and intraday deleveraging. A flush in perpetual futures contracts led to a spike in forced long liquidations, leaving price action vulnerable to retesting downside liquidity clusters between $85 and $88.
- On-Chain Fee Contraction and Retracting Revenue: Recent blockchain data highlights that quarterly network fees fell over 44% to approximately $50 million—a sharp decline from historical highs—while Total Value Locked (TVL) remains severely depressed relative to peak levels. Slower decentralized exchange trading and cooling speculative SPL token volume have reduced base-layer gas consumption and organic demand for native SOL.
- Governance Disputes and Validator Yield Concerns: Major institutional market participants and treasury entities have voiced opposition to upcoming governance proposals (SGP-0002 and SGP-0003) due to concerns that variable fee restructurings and accelerated disinflation could erode validator staking yields and deter corporate adoption. Additionally, recent upgrades cutting account storage costs raise technical concerns over accelerated state bloat and higher operational burdens for validator nodes.
- Spot ETF Inflow Stagnation and High-Beta Vulnerability: Institutional inflows into spot Solana ETFs remain concentrated in a single issuer while overall product flows have stalled with zero net additions across most major funds, leaving total fund assets fragile against market drawdowns. As a high-beta digital asset, SOL remains exposed to macro liquidity contractions and broader risk-off crypto market pullbacks.
Nothing in this material constitutes investment advice, personal recommendation, investment research, an offer, or a solicitation to buy or sell any financial instrument. The content has been prepared without consideration of your individual investment objectives, financial situation, or needs, and should not be treated as such.
Past performance is not a reliable indicator of future performance and/or results. Forward-looking scenarios or forecasts are not a guarantee of future performance. Actual results may differ materially from those anticipated.
Mitrade makes no representation or warranty as to the accuracy or completeness of the information provided and accepts no liability for any loss arising from reliance on such information.
Recommended Articles


