


CFDs are complex instruments and come with a high risk of losing money rapidly due to leverage. 80% of retail investor accounts lose money when trading CFDs with this provider. You should consider whether you understand how CFDs work and whether you can afford to take the high risk of losing your money.

Japan and South Korea Stocks Open Lower as KOSPI Falls Below 6,900; Samsung Electronics Tumbles Over 4% While SK Hynix Bucks Trend

Source Tradingkey

TradingKey - Japanese and South Korean stocks open down across the board! KOSPI falls below 6,900, Nikkei drops below 66,000; Samsung tumbles while SK Hynix defies the trend to surge over 3%.

During the Asian trading session on August 24, both Japanese and South Korean markets opened lower, influenced by high-level consolidation in U.S. tech stocks and cautious market sentiment. Among them, the Korea Composite Stock Price Index (KOSPI) fell 1.17%, breaking below the 6,900 mark to trade at 6,832.23 points. Heavyweight stocks diverged, with SK Hynix rising 3.58% to approach the 1.8 million mark, trading at 1,792,000 KRW; Samsung Electronics fell 4.26%, losing the 270,000 level to trade at 269,500 KRW.
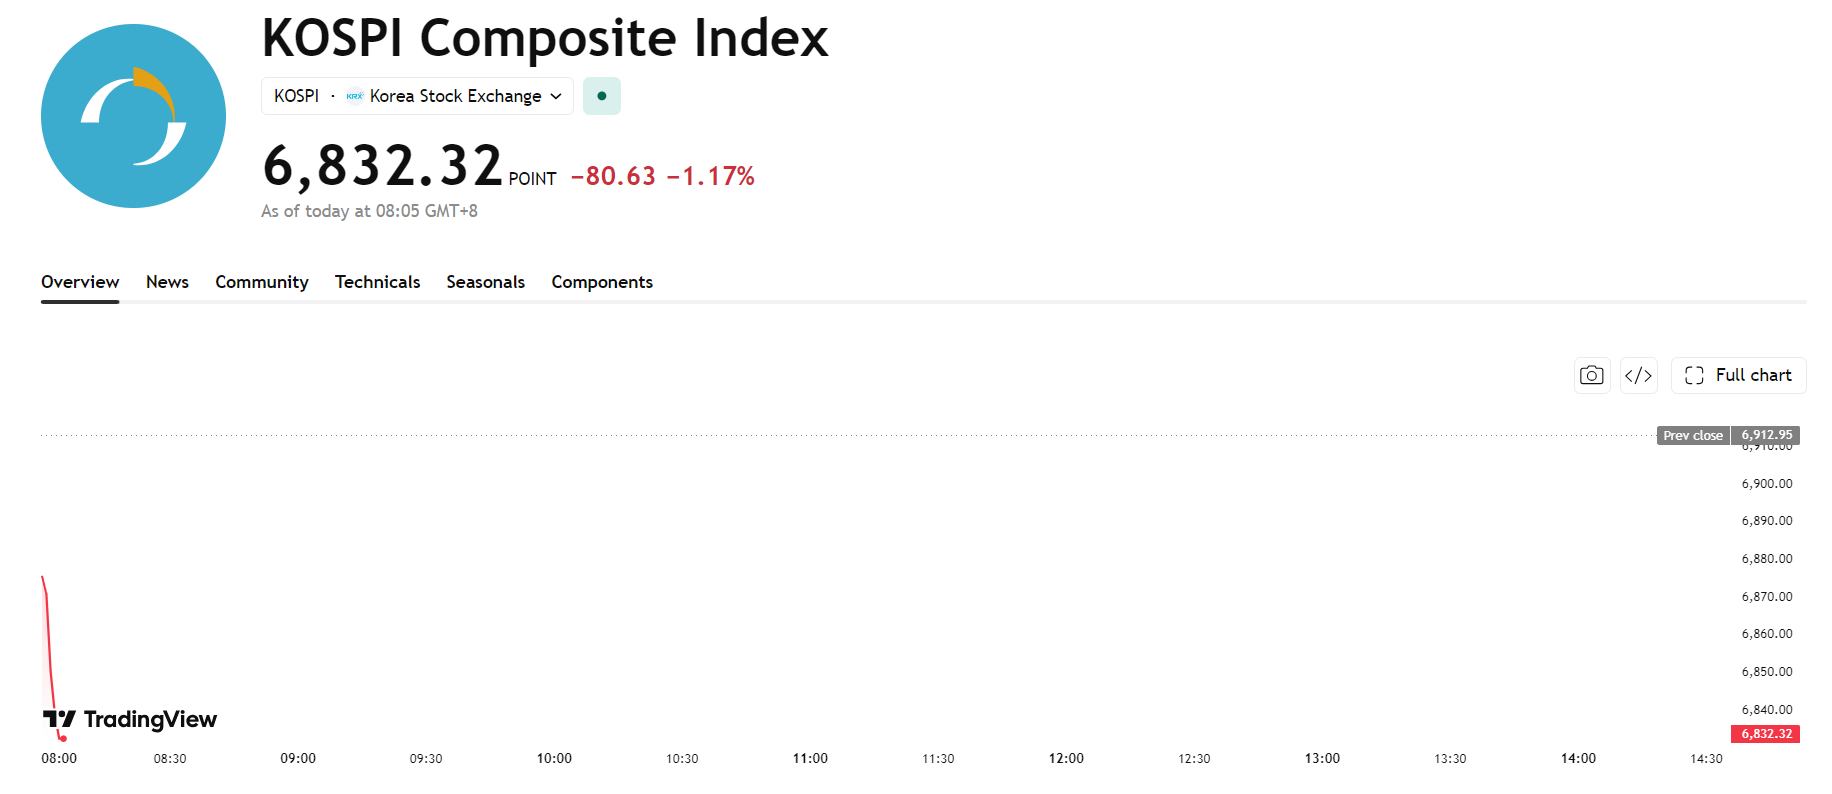
kospi-212505ab9b714336891edfb41e2fcf2eKOSPI Index Chart, Source: TradingView

The Nikkei 225 Index opened below the 66,000-point mark, falling over 150 points or 0.23% to 65,862.57 points. Heavyweight stocks fell across the board, with Kioxia dropping 0.39% to trade at 54,110 JPY, while SoftBank fell 0.97% to trade at 5,204 JPY.

Last Friday, Japanese and South Korean stocks diverged, with Japan falling and South Korea rising. Japanese stocks came under pressure in tech and heavyweights due to rising U.S. Treasury yields and Japan's July core inflation rate rising to 1.9%, ultimately closing slightly lower. The South Korean market opened weaker and tested lower, but rebounded sharply intra-day driven by a strong rally in semiconductor giants. Samsung Electronics surged 3.87%, boosted by expectations of shareholder returns worth hundreds of billions of KRW, while SK Hynix rose 2.31%.

Disclaimer: The content available on Mitrade Insights is provided for informational and marketing purposes only. It has not been prepared in accordance with legal requirements designed to promote the independence of investment research and is not subject to any prohibition on dealing ahead of the dissemination of investment research
Nothing in this material constitutes investment advice, personal recommendation, investment research, an offer, or a solicitation to buy or sell any financial instrument. The content has been prepared without consideration of your individual investment objectives, financial situation, or needs, and should not be treated as such.
Past performance is not a reliable indicator of future performance and/or results. Forward-looking scenarios or forecasts are not a guarantee of future performance. Actual results may differ materially from those anticipated.
Mitrade makes no representation or warranty as to the accuracy or completeness of the information provided and accepts no liability for any loss arising from reliance on such information.
placeholder
The Trumponomics Ebook: Oil Price Volatility in the Iran War Understand how the Strait of Hormuz shock moved markets, and what CFD traders watched next.
Author  Rachel Weiss
Aug 18, Tue
Understand how the Strait of Hormuz shock moved markets, and what CFD traders watched next.
placeholder
WTI consolidates below $84.50, two-week top as bullish bias remains amid Hormuz standoffWest Texas Intermediate (WTI) – the benchmark US Crude Oil price – extends its consolidative price move through the first half of the European session and currently trades near the $84.25-$84.30 area, close to a two-week high set earlier this Tuesday.
Author  FXStreet
Aug 18, Tue
West Texas Intermediate (WTI) – the benchmark US Crude Oil price – extends its consolidative price move through the first half of the European session and currently trades near the $84.25-$84.30 area, close to a two-week high set earlier this Tuesday.
placeholder
Silver Price Forecast: XAG/USD remains sideways around $65, FOMC takes centre stageSilver price (XAG/USD) continues to trade in a limited range at around $65.30 during the European trading session on Tuesday.
Author  FXStreet
Aug 18, Tue
Silver price (XAG/USD) continues to trade in a limited range at around $65.30 during the European trading session on Tuesday.
placeholder
BTC holds recent gains above 50-day EMA amid improving momentumBitcoin (BTC) slides slightly but holds most of the recent gains, reclaiming the 50-day Exponential Moving Average (EMA) at $64,300 at the time of writing on Tuesday after rising 2.5% the previous day.
Author  FXStreet
Aug 18, Tue
Bitcoin (BTC) slides slightly but holds most of the recent gains, reclaiming the 50-day Exponential Moving Average (EMA) at $64,300 at the time of writing on Tuesday after rising 2.5% the previous day.
placeholder
Gold steadies below $4,350 as surging yields offset support from Fed rate-hold betsGold price (XAU/USD) holds steady near $4,335 after pulling back from an early-June top near $4,450 during the early Asian trading hours on Wednesday.
Author  FXStreet
Aug 19, Wed
Gold price (XAU/USD) holds steady near $4,335 after pulling back from an early-June top near $4,450 during the early Asian trading hours on Wednesday.
goTop
quote