



Ripple Price Prediction: Plunges After Hitting $1.7, Will XRP Continue to Rise?
TradingKey - On August 24, Ripple (XRP) price continued to pull back below the $1.5 mark, trading at $1.4819. Last Saturday (August 22), XRP price surged over 20%, briefly spiking to touch the $1.7 level to set a new high since January this year, before suffering a sharp pullback and rapid sell-off. So, will XRP continue to rise in the future?
Why Is XRP Plunging?
The direct cause of XRP's surge and pullback is that Bitcoin (BTC) stalled after approaching the $80,000 mark and even fell below the $76,000 level at one point, triggering a market-wide crypto plunge and dragging XRP down into a correction as well. As of writing, Bitcoin's price has rebounded somewhat, hovering at $77,134.
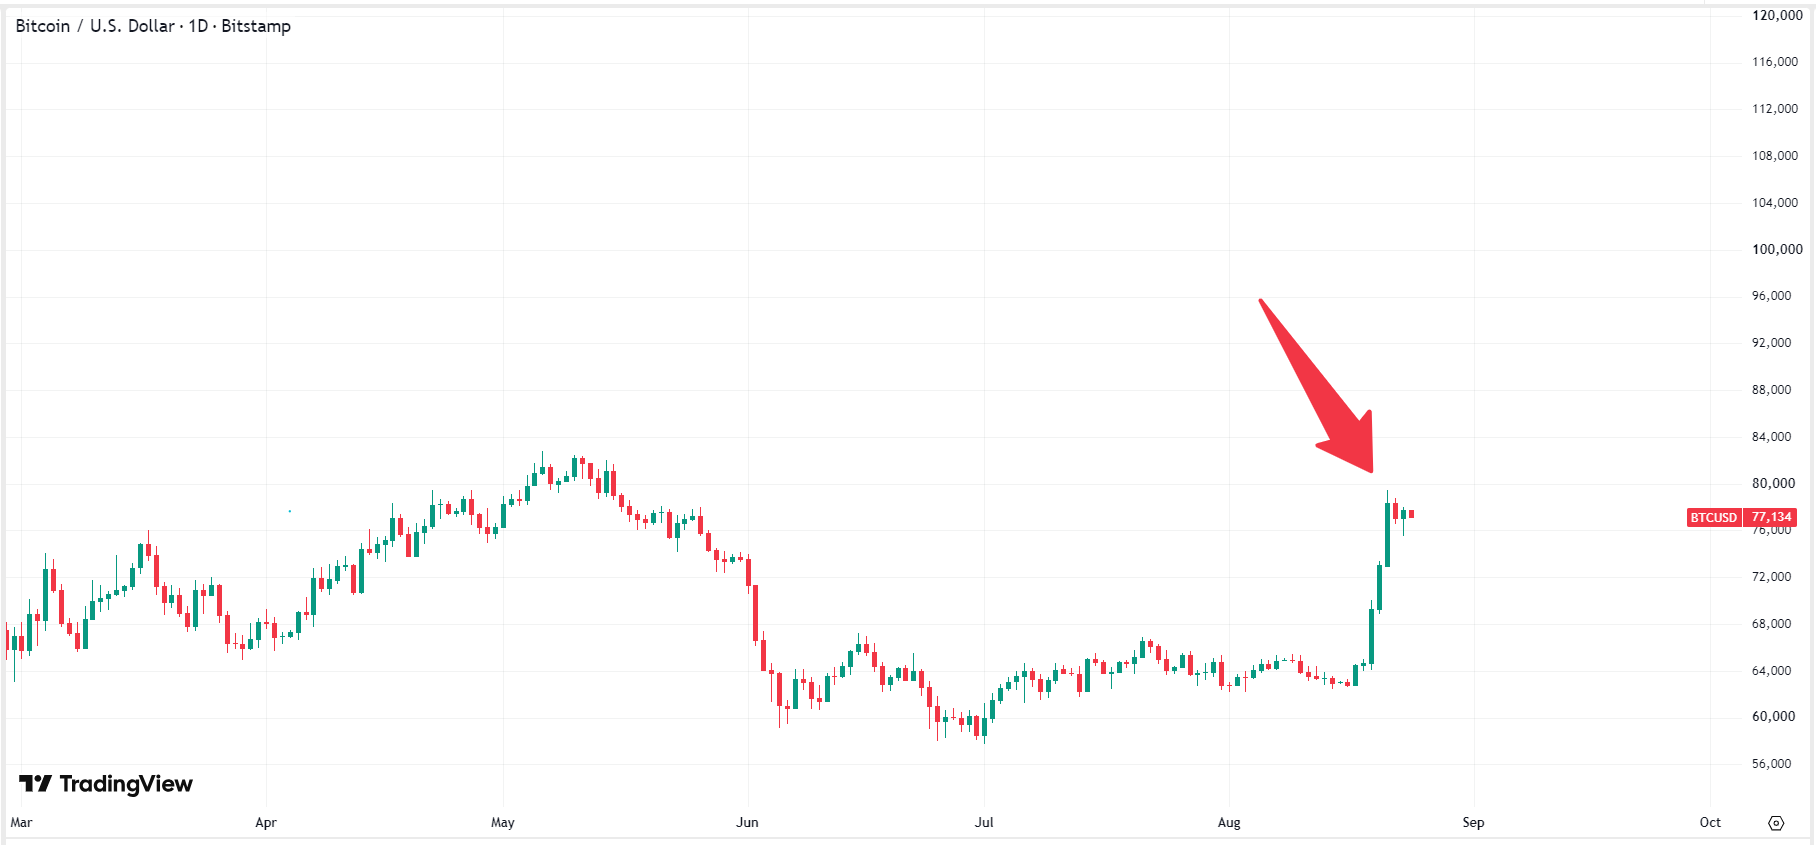 Bitcoin price chart, Source: TradingView
Last Wednesday, the price of XRP initiated a rally from around $1, surging 70% in just 4 days, triggering market-wide FOMO buying and causing contract funding rates to surge. When the price touched the dense resistance zone of $1.7, buying momentum stalled, and a slight pullback triggered a chain reaction of stop-losses on high-leverage long positions, amplifying short-term declines. It is worth noting that above $1.7 lies multiple swing highs throughout 2025, accumulating a large amount of trapped positions, which immediately unleashed selling pressure from investors looking to break even once that level was reached.
Will XRP Keep Rising?
At present, Bitcoin and the broader crypto market have largely digested last week's positive news from the US and urgently need new bullish catalysts for support; otherwise, prices will struggle to sustain current levels, let alone rally further, and the same is true for XRP. In the short term, the Clarity Act serves as the core foundation for removing XRP's medium-to-long-term risk premium. If the US Senate passes it in mid-September as indicated by the White House, XRP is expected to continue its upward momentum and break through $1.7.
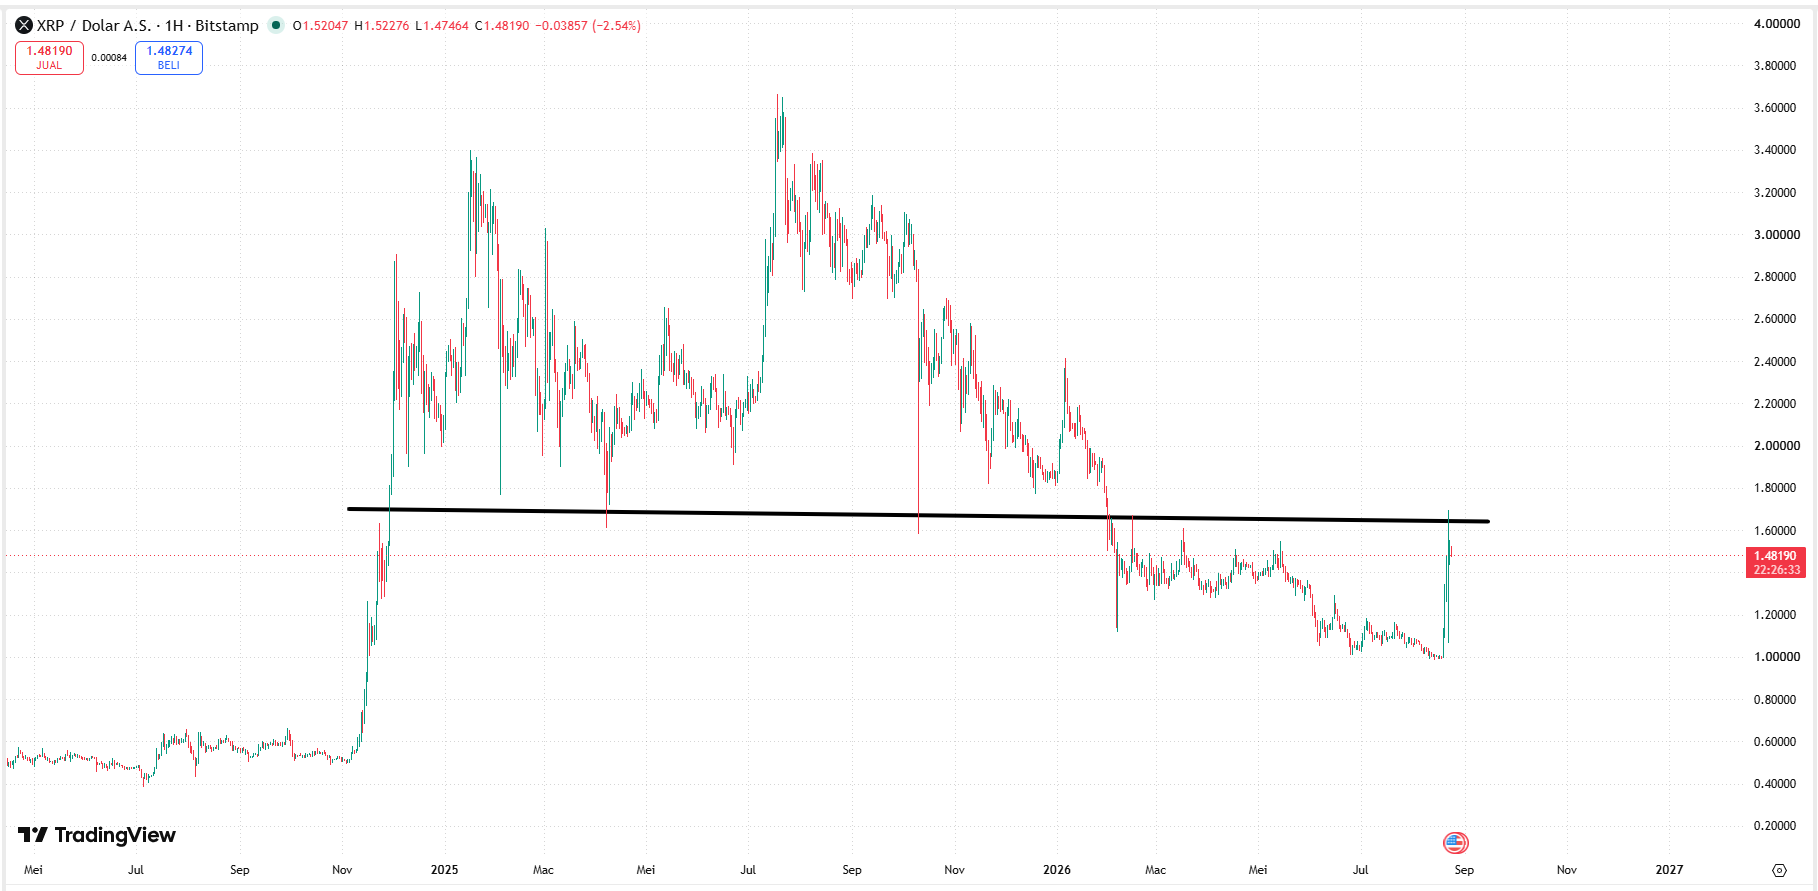 XRP price chart, Source: TradingView
However, the area above $1.7 is a heavy overhead supply zone for XRP where trapped investors look to break even, requiring a surge in spot volume and turnover for an effective breakout. If it can clear this strong resistance level, it is expected to challenge round-number hurdles one by one, such as $2 and $3. In the absence of new bullish catalysts, a pullback in XRP is highly likely, with the first strong support level at $1.35–$1.4, corresponding to the 0.382 Fibonacci retracement level. If XRP stabilizes at this level, its bullish structure will remain very healthy.
Nothing in this material constitutes investment advice, personal recommendation, investment research, an offer, or a solicitation to buy or sell any financial instrument. The content has been prepared without consideration of your individual investment objectives, financial situation, or needs, and should not be treated as such.
Past performance is not a reliable indicator of future performance and/or results. Forward-looking scenarios or forecasts are not a guarantee of future performance. Actual results may differ materially from those anticipated.
Mitrade makes no representation or warranty as to the accuracy or completeness of the information provided and accepts no liability for any loss arising from reliance on such information.
Recommended Articles


