



Bitcoin (BTCUSD) Is up 1.05% on Aug 30: Why It Happened
Bitcoin (BTCUSD) is up 1.05% at Aug 30 09:50(ET), now at $78920, with a 7-day up of 2.00%.
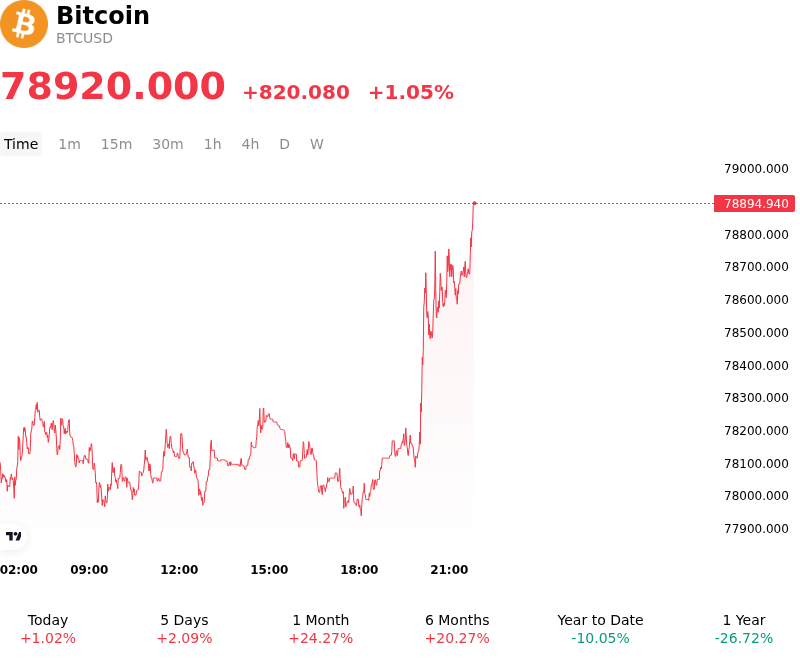
What is driving Bitcoin (BTCUSD)’s stock price up today?
Bitcoin advanced as spot exchange-traded fund inflows provided sustained underlying spot demand, supporting ongoing capital allocations across institutional portfolios. The persistent demand through regulated investment vehicles continues to absorb liquid exchange supply, reinforcing investor confidence following a broader repricing of digital assets. Institutional allocators remain focused on Bitcoin as an asset capable of hedging against fiscal expansion and sovereign balance sheet growth, which has improved overall market depth and stabilized order book liquidity.
Macroeconomic liquidity dynamics further supported price action as market participants calibrated expectations regarding Federal Reserve policy, sovereign debt issuance, and foreign exchange movements. Lower real yields and ongoing softness in the U.S. dollar have reduced the opportunity cost of holding non-yielding digital assets, reinvigorating the macroeconomic debasement trade narrative. As investors evaluate long-term fiscal trajectories and central bank policy paths, capital flows continue to favor scarce digital assets with defined supply schedules, maintaining a constructive background for broader crypto allocations.
Derivatives positioning also contributed to the upward intraday movement, with selective short liquidations accelerating price discovery as leveraged bearish positions were closed. Funding rates across major perpetual futures venues remained balanced, signaling that the advance was supported by spot-market buying rather than excessive speculative leverage. Nevertheless, institutional investors continue to monitor broader regulatory developments, macroeconomic yield movements, and liquidity concentration risks, which could trigger localized volatility if ETF inflow momentum moderates or macroeconomic policy signals shift abruptly.
Technical Analysis of Bitcoin (BTCUSD)
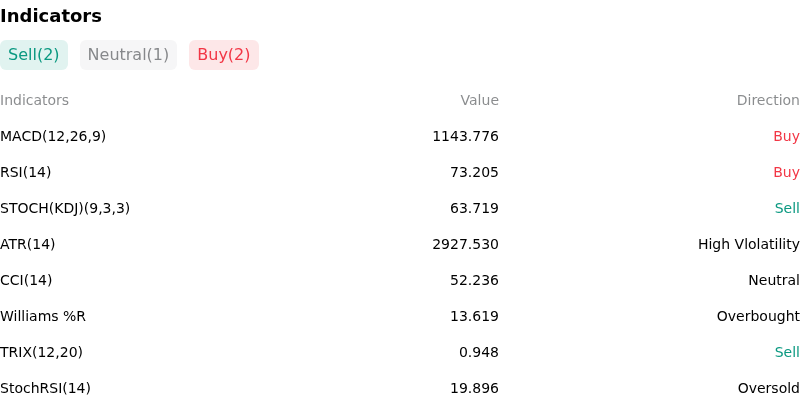
Technically, Bitcoin (BTCUSD) shows a MACD (12,26,9) value of 1143.776, indicating a buy signal. The RSI at 73.205 suggests buy condition and the Williams %R at 13.619 suggests overbought condition. Please monitor closely.
More details about Bitcoin (BTCUSD)
Recent Events and Risks:
- Hawkish Monetary Policy Repricing: Federal Reserve commentary highlighting persistent headline PCE inflation at 3.7% caused futures markets to reprice a nearly 60% probability of a September rate hike, exerting immediate macro pressure on risk-sensitive assets like Bitcoin.
- Reversal in Spot ETF Inflows: U.S. spot Bitcoin ETFs snapped a nine-day $3 billion buying streak by recording $201.8 million in net daily outflows—led by $114.9 million in withdrawals from ARK 21Shares—signaling a cooling in institutional spot demand.
- Long Liquidation Cascade and Leverage Unwind: Rejection at the $81,000–$81,500 key technical resistance zone triggered over $486 million in crypto-wide liquidations, with long positions accounting for $368 million of the flush and escalating intraday downside volatility.
- On-Chain Whale Distribution and Profit-Taking: On-chain metrics show short-term holder whales transferred over 43,000 BTC in profit to exchanges following the rapid August rally, establishing dense overhead supply barriers between $81,000 and $86,000.
Nothing in this material constitutes investment advice, personal recommendation, investment research, an offer, or a solicitation to buy or sell any financial instrument. The content has been prepared without consideration of your individual investment objectives, financial situation, or needs, and should not be treated as such.
Past performance is not a reliable indicator of future performance and/or results. Forward-looking scenarios or forecasts are not a guarantee of future performance. Actual results may differ materially from those anticipated.
Mitrade makes no representation or warranty as to the accuracy or completeness of the information provided and accepts no liability for any loss arising from reliance on such information.
Recommended Articles


