



BNB (BNBUSD) Fluctuated Significantly on Aug 30: Key Variables Behind the Move
BNB (BNBUSD) is up 1.04% at Aug 30 09:55(ET), now at $698, with a 7-day down of 0.01%.
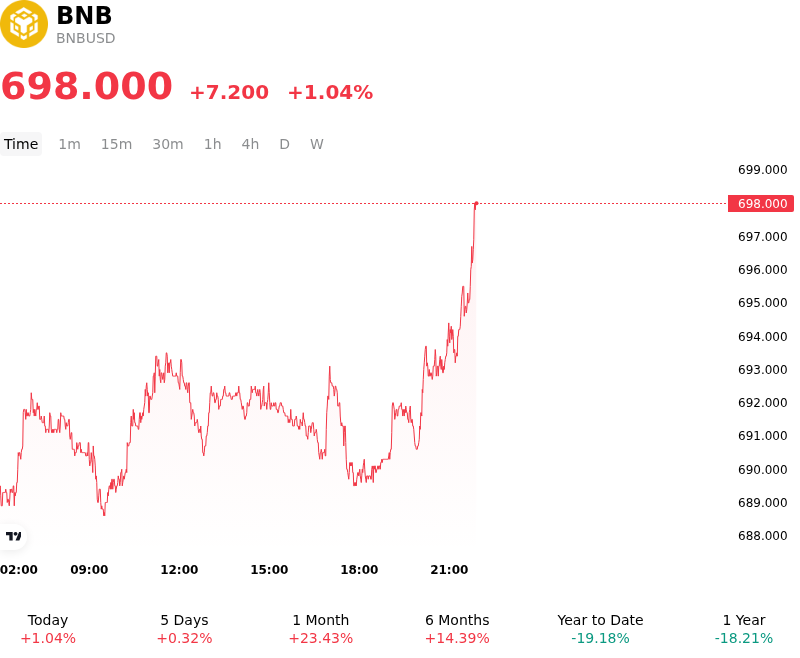
What is driving BNB (BNBUSD)’s stock price up today?
Capital flowed into BNB as strong fundamentals within the BNB Chain ecosystem and sustained platform utility on the underlying exchange improved investor sentiment. Following the recent deployment of the Pasteur hard fork, which upgraded cross-chain verification infrastructure and network throughput, on-chain activity remained robust with elevated decentralized exchange volume and active address metrics. These fundamental protocol enhancements reinforced long-term adoption expectations, attracting spot accumulation from market participants seeking exposure to scalable Layer-1 network infrastructure.
In addition to protocol performance, liquidity conditions were bolstered by structured platform engagement and derivatives market positioning. Active promotional incentives, launchpool utility, and transaction fee discount mechanisms on the exchange continue to drive structural demand for holding BNB. As price action stabilized above key psychological support levels, derivative markets experienced constructive position adjustments with balanced funding rates, reflecting institutional and sophisticated trader participation rather than purely speculative leverage.
From a broader macro perspective, stabilizing market sentiment across major digital assets provided a supportive environment for capital deployment. While near-term volatility remains present due to evolving macroeconomic rate expectations and potential profit-taking near major resistance zones, BNB’s ongoing supply burn mechanisms, expanding decentralized ecosystem volume, and core infrastructure upgrades continue to support a constructive structural outlook for institutional digital asset allocation.
Technical Analysis of BNB (BNBUSD)
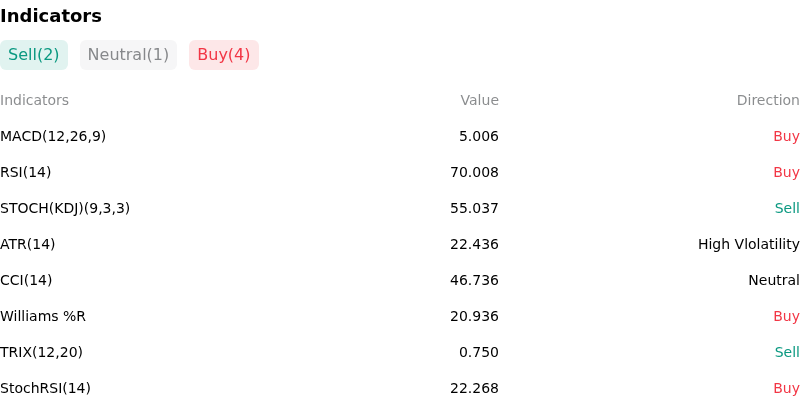
Technically, BNB (BNBUSD) shows a MACD (12,26,9) value of 5.006, indicating a buy signal. The RSI at 70.008 suggests buy condition and the Williams %R at 20.936 suggests buy condition. Please monitor closely.
More details about BNB (BNBUSD)
Recent Events and Risks:
- Overhead Resistance and Momentum Exhaustion: Following BNB's recent rejection near the $712–$725 resistance ceiling, momentum indicators indicate overbought conditions with daily RSI exceeding 78, leaving BNBUSD vulnerable to downside retracements toward the $687–$690 support range.
- Derivatives Leverage and Liquidation Cascade Threat: Coinglass liquidation heatmap data reveals a heavily long-skewed derivatives market with concentrated long liquidation clusters between $680 and $685, creating acute risk of a long liquidation cascade if intraday price action breaks below $687.
- On-Chain Leveraged Lending Concentration: On-chain monitoring indicates large whale transfers depositing BNB into decentralized lending protocols like Venus to execute looped leveraged borrowing, elevating systemic risk of automated, forced sell-offs if market prices drop into liquidation thresholds.
- Post-Pasteur Hard Fork Operational Risks: Following the deployment of the Pasteur hard fork (v1.7.7 client update) across BNB Smart Chain, validator node synchronization and cross-chain bridge updates introduce near-term protocol execution risks and localized liquidity friction.
Nothing in this material constitutes investment advice, personal recommendation, investment research, an offer, or a solicitation to buy or sell any financial instrument. The content has been prepared without consideration of your individual investment objectives, financial situation, or needs, and should not be treated as such.
Past performance is not a reliable indicator of future performance and/or results. Forward-looking scenarios or forecasts are not a guarantee of future performance. Actual results may differ materially from those anticipated.
Mitrade makes no representation or warranty as to the accuracy or completeness of the information provided and accepts no liability for any loss arising from reliance on such information.
Recommended Articles


