



Gold Drops Nearly 3% Below $4,500: Fed Chair Warsh Signals Hawkish Stance, Reigniting Rate Hike Expectations as Treasury Yields Rise
TradingKey - On August 28 ET, spot gold (XAUUSD) plunged about 3%, falling below the $4,500 mark to hit a new low since August 20. The primary catalyst was a hawkish policy signal delivered by Federal Reserve Chair Warsh at the Jackson Hole annual symposium. Warsh explicitly stated that recent inflation data is not yet sufficient to prove that price pressures have eased substantially, and reiterated that the 2% inflation target remains "unwavering and non-negotiable."
He also pointed out that current financial conditions are not restrictive, and interest rates remain the Fed's primary tool to fulfill its dual mandate. This means that if inflation fails to cool quickly enough, the Fed still reserves room to further tighten monetary policy.
Why Gold Is Plunging
As a result, markets raised their expectations of Federal Reserve rate hikes, and traders resumed betting that future interest rates could remain high or even rise further. Driven by this, U.S. Treasury yields reversed after a sharp drop, with 10-year and 2-year yields rebounding noticeably.
Rising yields mean higher potential returns for interest-bearing assets such as deposits and bonds. Because gold itself pays no interest, the interest income investors forgo by holding gold increases, thereby raising the opportunity cost of holding gold.
Meanwhile, growing expectations of rate hikes also supported a stronger U.S. dollar, further diminishing the appeal of dollar-denominated gold. Under the transmission chain of 'rising rate-hike expectations → U.S. Treasury yield rebound → higher opportunity cost of holding gold → stronger U.S. dollar weighing on gold prices,' gold came under pressure and fell.
What's Next for Gold? Three Key Variables to Watch
Whether U.S. inflation remains persistently above the 2% target: Warsh has established the direction and speed of underlying inflation moderation as key criteria. If inflation stickiness persists, gold may continue to face pressure from interest rate expectations.
How rate-hike pricing for the September meeting changes: Public reports show that after Warsh's speech, market bets on a 25-basis-point rate hike in September increased noticeably, though Warsh himself gave no explicit rate-hike timeline, leaving future decisions dependent on incoming data.
The interplay between the U.S. dollar and real U.S. Treasury yields: In the short term, gold is driven not only by nominal interest rates but also by dollar strength and shifts in real rates. If the dollar strengthens and real yields rise, both the cost of holding gold and its valuation pressure could increase.
Gold Technical Analysis
From a daily chart perspective, gold halted its decline near $3,942.1 and staged a rapid rebound, briefly breaching $4,600 and peaking near $4,700. Following recent high-level consolidation, gold prices plunged by over $100 today. This indicates that short-term breakout momentum has cooled significantly, and the prior upward structure needs to be reconfirmed through a pullback to support.
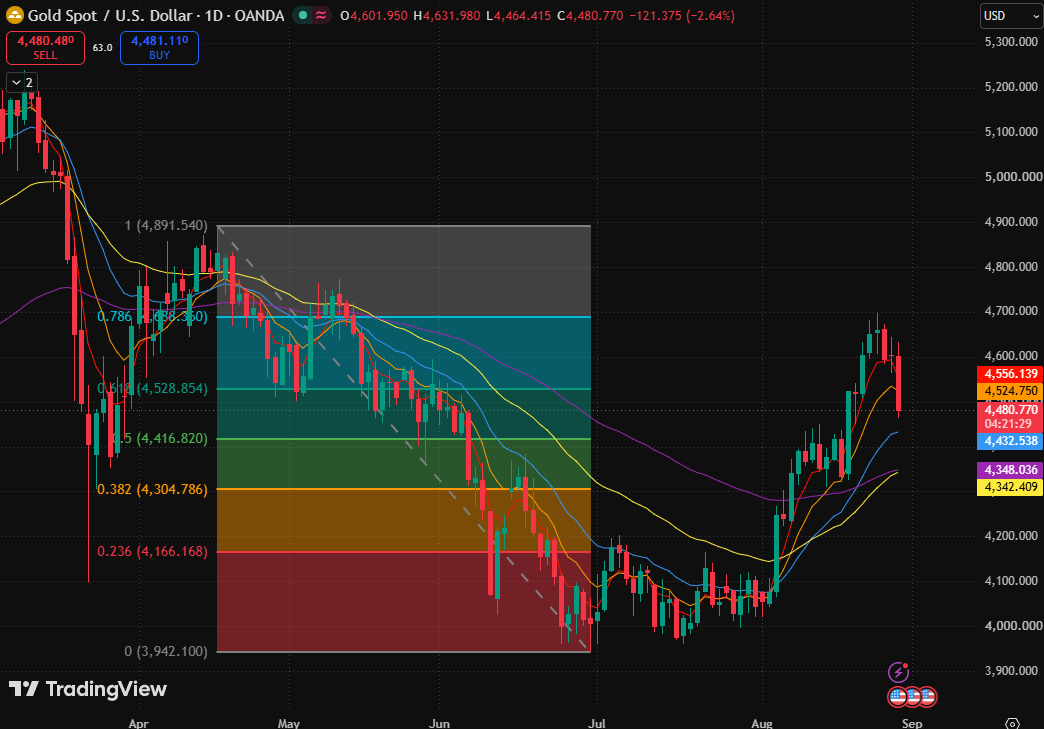
Spot Gold Price, Source: TradingView
Currently, the most critical downside level is the 0.5 Fibonacci retracement level ($4,416.82). As long as gold prices can halt their decline above this level and reclaim the short-term moving average resistance zone between $4,523.86 and $4,554.51, the current movement can still be defined as a technical pullback following a strong rally.
If prices decisively break below $4,416.82 and a subsequent rebound fails to reclaim it, the scope of the pullback will expand further. Downside attention should turn sequentially to actual buying support near the 20-day moving average ($4,432.07), the 0.382 Fibonacci retracement level ($4,304.78), and the medium-term support zone formed by the 80-day moving average ($4,342.17) and 160-day moving average ($4,347.91).
Regarding upside potential, even if prices reclaim $4,528.85, a trend resumption cannot be confirmed. Moving forward, it remains necessary to observe whether prices can hold firm above the 5-day moving average ($4,554.51), avoiding mistaking a technical bounce during high-level consolidation for a new primary upward trend.
Nothing in this material constitutes investment advice, personal recommendation, investment research, an offer, or a solicitation to buy or sell any financial instrument. The content has been prepared without consideration of your individual investment objectives, financial situation, or needs, and should not be treated as such.
Past performance is not a reliable indicator of future performance and/or results. Forward-looking scenarios or forecasts are not a guarantee of future performance. Actual results may differ materially from those anticipated.
Mitrade makes no representation or warranty as to the accuracy or completeness of the information provided and accepts no liability for any loss arising from reliance on such information.
Recommended Articles


