



Bitcoin Weekly Forecast: Billions in ETF inflows push BTC toward decisive breakout
- Bitcoin rises over 2% this week, holding near $80,000 after testing the 50-week SMA at $81,114.
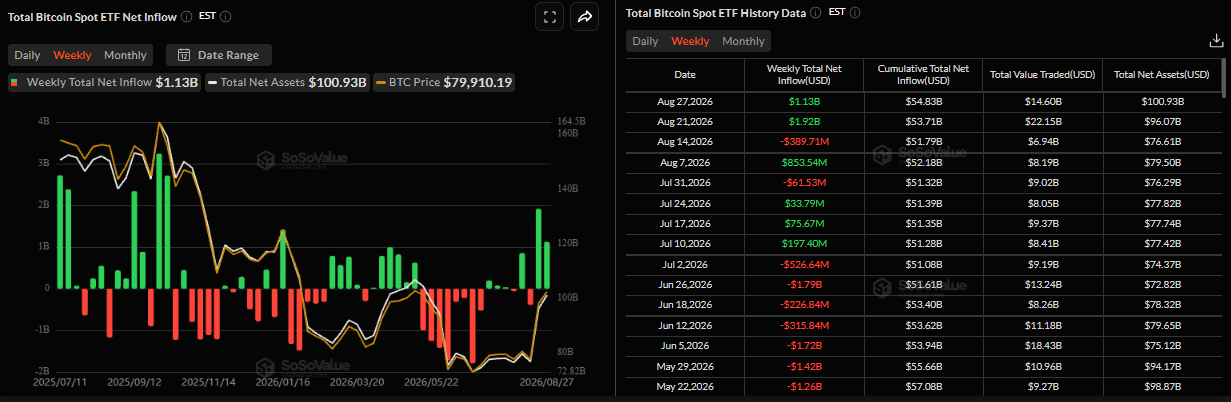
- US-listed spot Bitcoin ETFs are on track for a second straight week of billion-dollar inflows, with $1.13 billion recorded through Thursday.
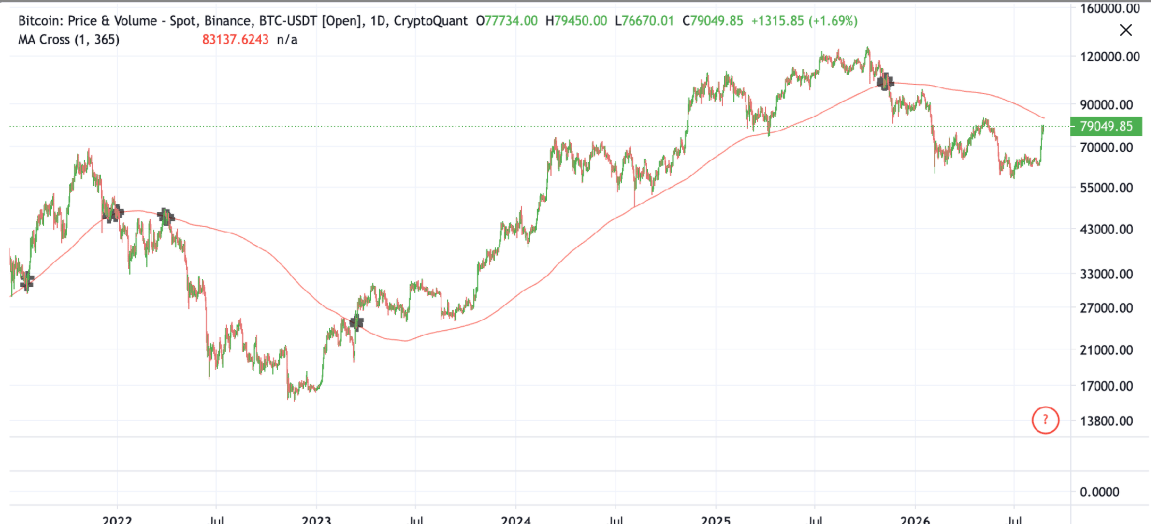
- BTC’s 365-day moving average, currently near $83,000, remains a key resistance level; a decisive break above it could confirm a new bull market, while failure to reclaim it may trigger an early correction.
Bitcoin (BTC) extends gains so far this week, trading near $80,000 after testing the 50-week Simple Moving Average (SMA) at $81,114 earlier. Strong institutional demand is supporting the rally, with spot BTC Exchange Traded Funds (ETFs) on track to record a second consecutive week of billion-dollar inflows. Meanwhile, traders should be cautious as BTC remains below its 365-day moving average near $83,000, a level which could determine the Crypto King’s market regime.
Institutional demand strengthens
Institutional demand for Bitcoin supported this week’s ongoing price surge. SoSoValue data showed spot ETFs are set to record a second straight week of billion-dollar inflows, with $1.13 billion recorded through Thursday. Renewed institutional interest reflects growing demand for BTC and supports its price outlook.
All eyes on Jackson Hole Symposium
Investors await Federal Reserve (Fed) Chair Kevin Warsh’s speech at the Jackson Hole Symposium on Friday, which could provide fresh clues about the bank’s monetary policy and could trigger volatility across risky assets such as BTC.
“Warsh has deliberately provided less forward guidance since becoming Chair, making the speech relevant less for a predetermined September signal than for how he frames inflation, growth and the broader conduct of monetary policy,” said a QCP Capital analyst.
If Warsh sounds dovish or signals potential interest rate cuts, it could support BTC, boosting risk appetite, while a hawkish stance could weigh on risk assets.
Macroeconomic data sends mixed signals
US inflation data offered a mixed backdrop for BTC this week. The core Personal Consumption Expenditures (PCE) Price Index inflation, the Fed’s preferred inflation gauge, held steady at 3.3% YoY in July, the US Bureau of Economic Analysis (BEA) revealed on Wednesday. This figure came in line with market expectations. On a monthly basis, the headline PCE Price Index and the core PCE Price Index both rose by 0.2% in July.
Following the data release, the market significantly increased its bets on a September interest rate increase. According to the CME FedWatch Tool, the probability of a Fed rate hike at the next meeting rose to 40% from 36% before the data release.
However, optimism about a potential reopening of the Strait of Hormuz amid diplomatic efforts involving Iran and Oman could ease oil-driven inflation concerns and reduce the need for further monetary tightening, which could support BTC.
Iran’s Security Chief Mohsen Rezaei said on Friday that Tehran is preparing a list of its conditions to open the Strait of Hormuz in response to a request by mediators, adding that conditions include ending the war in the region, per Reuters.
This easing of conditions lifted mild risk sentiment in the market, with risky assets such as BTC holding around $80,000 on Friday.
BTC’s 365-day moving average remains a key bull-market test
CryptoQuant reported this week that BTC’s apparent spot demand is growing at its fastest monthly pace since late December, and spot and futures demand are expanding together for the first time since early October 2025.
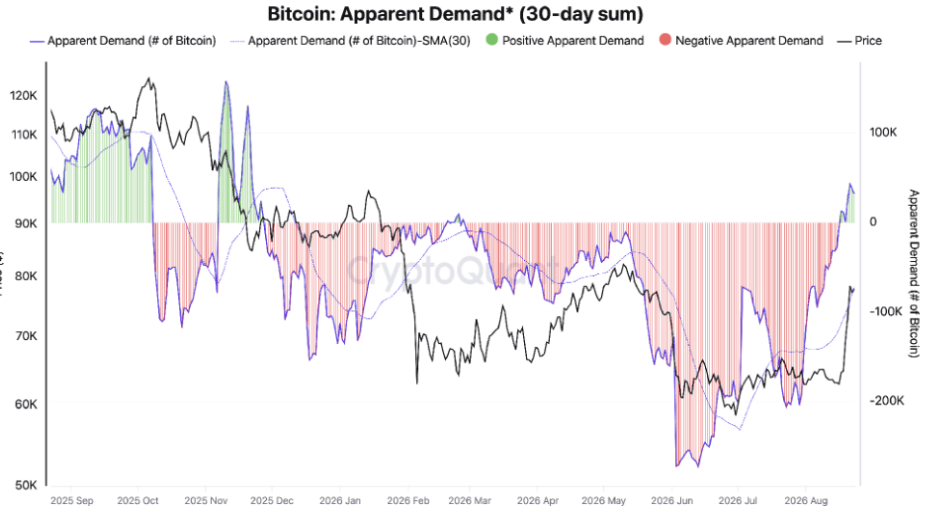
“This is a genuine regime shift, the initial phase of a new bull market… but it needs official confirmation. Valuation, demand and liquidity have all switched into bull mode. The official confirmation is a close above Bitcoin’s 365-day moving average, which stands at ~$83,000,” CryptoQuant’s analyst said.
Bitcoin technical outlook: Near 50-week SMA
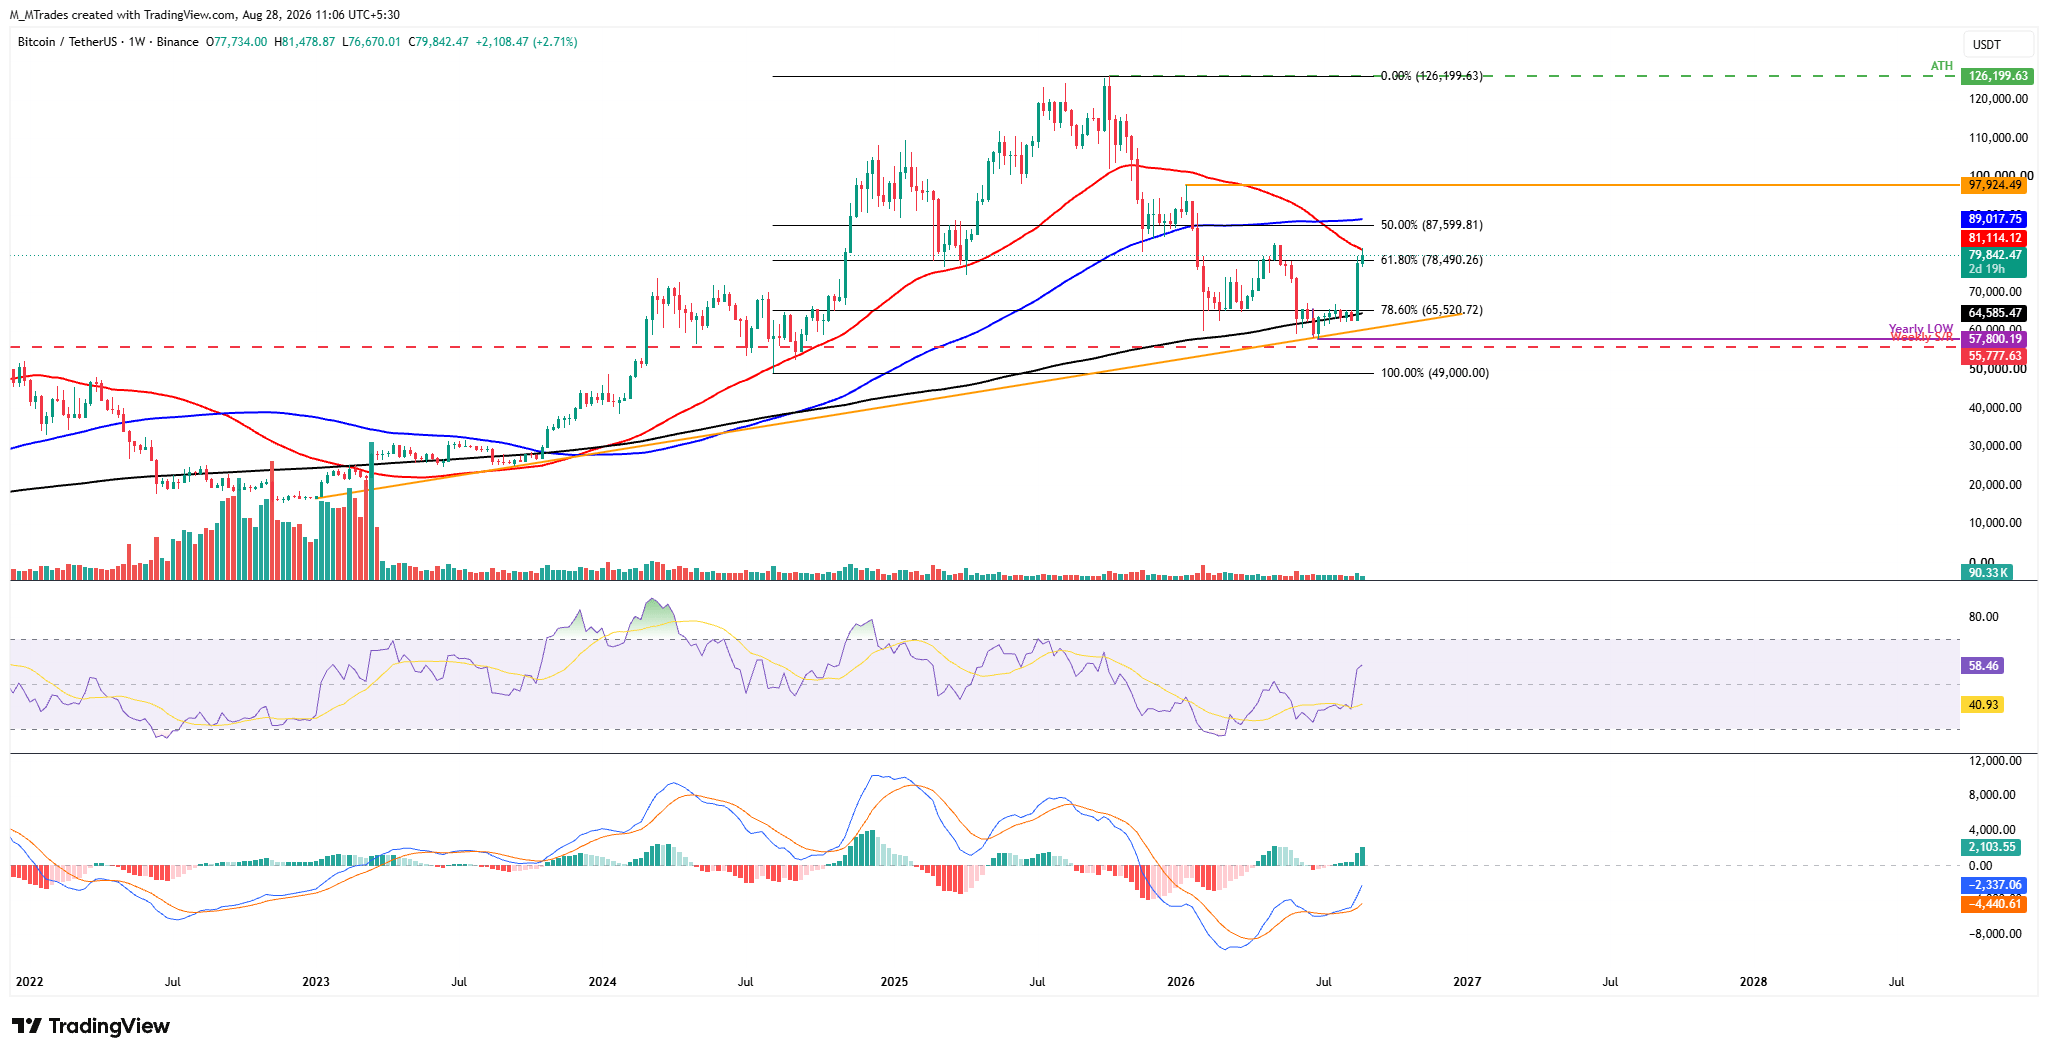
The Crypto King extends its gains, up over 2% so far this week. BTC trades around $80,000 on Friday after testing the 50-week Simple Moving Average (SMA) at $81,114 earlier this week.
If BTC closes above the immediate resistance at the 50-week SMA at $81,114 on a weekly basis, it could extend the rally toward the 50% Fibonacci retracement level at $87,599, which roughly coincides with the 100-week SMA at $89,017.
Momentum remains strong and shows signs of optimism. On the weekly chart, the Relative Strength Index (RSI) stays firmly above the neutral level of 50, reading 58 on Friday, indicating improving momentum. In addition, the Moving Average Convergence Divergence (MACD) flipped to a bullish crossover in mid-July and remains intact, with rising green histogram bars, supporting a positive outlook.
If BTC corrects, it could extend the decline toward the key psychological level of $70,000.
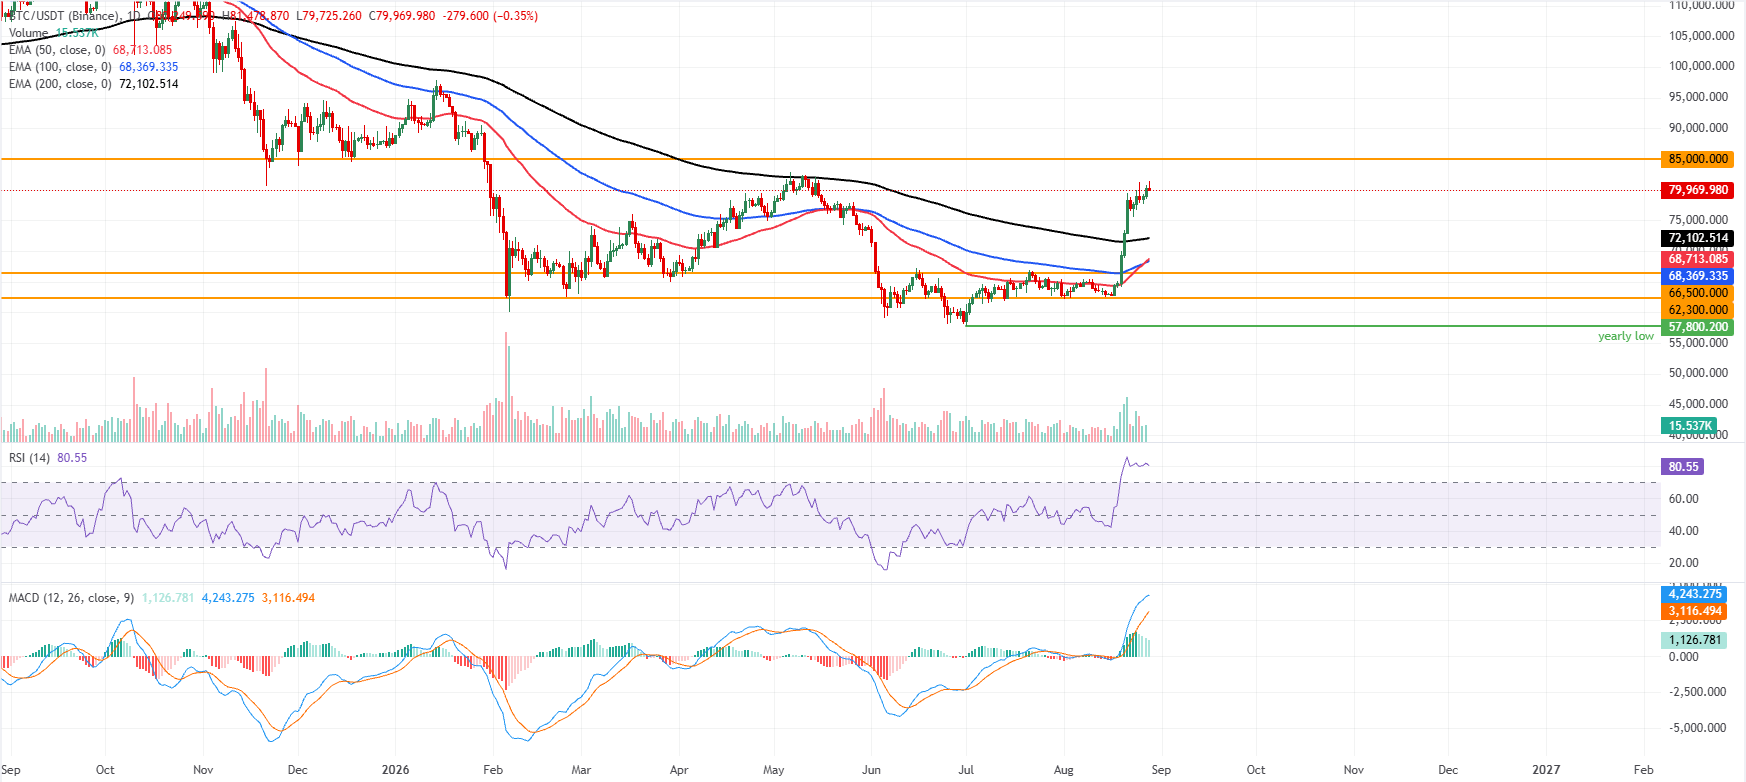
On the daily chart, BTC maintains a clear bullish bias as price holds well above the 50-day, 100-day, and 200-day Exponential Moving Averages (EMAs) clustered between roughly $68,400 and $72,100.
Momentum remains strong but increasingly stretched, with the daily RSI hovering in overbought territory above 80 and the MACD indicator firmly positive, suggesting sustained upside pressure but also a rising risk of a corrective pause.
On the topside, the next notable resistance is the psychological and technical barrier at $85,000, where profit-taking could intensify if the rally extends.
On the downside, initial support is found at the rising 50-day EMA at $68,713, reinforced by the 100-day EMA at $68,369 and the 200-day EMA at $72,102, with additional structural floors at $66,500 and $62,300; a break back through this EMA cluster would be needed to suggest a more sustained corrective phase.
(The technical analysis of this story was written with the help of an AI tool. Know more.)
Bitcoin, altcoins, stablecoins FAQs
Bitcoin is the largest cryptocurrency by market capitalization, a virtual currency designed to serve as money. This form of payment cannot be controlled by any one person, group, or entity, which eliminates the need for third-party participation during financial transactions.
Altcoins are any cryptocurrency apart from Bitcoin, but some also regard Ethereum as a non-altcoin because it is from these two cryptocurrencies that forking happens. If this is true, then Litecoin is the first altcoin, forked from the Bitcoin protocol and, therefore, an “improved” version of it.
Stablecoins are cryptocurrencies designed to have a stable price, with their value backed by a reserve of the asset it represents. To achieve this, the value of any one stablecoin is pegged to a commodity or financial instrument, such as the US Dollar (USD), with its supply regulated by an algorithm or demand. The main goal of stablecoins is to provide an on/off-ramp for investors willing to trade and invest in cryptocurrencies. Stablecoins also allow investors to store value since cryptocurrencies, in general, are subject to volatility.
Bitcoin dominance is the ratio of Bitcoin's market capitalization to the total market capitalization of all cryptocurrencies combined. It provides a clear picture of Bitcoin’s interest among investors. A high BTC dominance typically happens before and during a bull run, in which investors resort to investing in relatively stable and high market capitalization cryptocurrency like Bitcoin. A drop in BTC dominance usually means that investors are moving their capital and/or profits to altcoins in a quest for higher returns, which usually triggers an explosion of altcoin rallies.
Nothing in this material constitutes investment advice, personal recommendation, investment research, an offer, or a solicitation to buy or sell any financial instrument. The content has been prepared without consideration of your individual investment objectives, financial situation, or needs, and should not be treated as such.
Past performance is not a reliable indicator of future performance and/or results. Forward-looking scenarios or forecasts are not a guarantee of future performance. Actual results may differ materially from those anticipated.
Mitrade makes no representation or warranty as to the accuracy or completeness of the information provided and accepts no liability for any loss arising from reliance on such information.
Recommended Articles


