



Cardano Price Forecast: Whale accumulation fails to dispel uncertain ADA outlook
- Cardano edges below $0.220 on Friday after slipping over 7% so far this week.
- Santiment data shows certain whale wallets are accumulating ADA tokens during its recent price pullback.
- Mixed on-chain and derivatives metrics suggest ADA’s near-term outlook remains uncertain despite whale accumulation.
Cardano (ADA) edges below $0.220 at the time of writing on Friday after losing over 7% so far this week. Despite the recent weakness, on-chain data shows that some whale wallets are using the pullback to accumulate ADA tokens. Meanwhile, mixed on-chain and derivatives metrics point to a cautious outlook as traders assess whether the recent decline could extend further.
Whale wallets are buying ADA dips
Santiment’s Supply Distribution data shows large-wallet holders (whales) buying ADA during recent price dips, a move that supports a positive outlook for the token.
The metric indicates that whales holding between 10 million and 100 million ADA tokens (blue line) have accumulated 160 million ADA tokens since Sunday. This buy-the-dip scenario signals continued long-term interest among large-wallet holders; however, it failed to lift the short-term price this week.
 [09-1787892977631.33.10, 28 Aug, 2026].png)
Mixed outlook keeps recovery uncertain
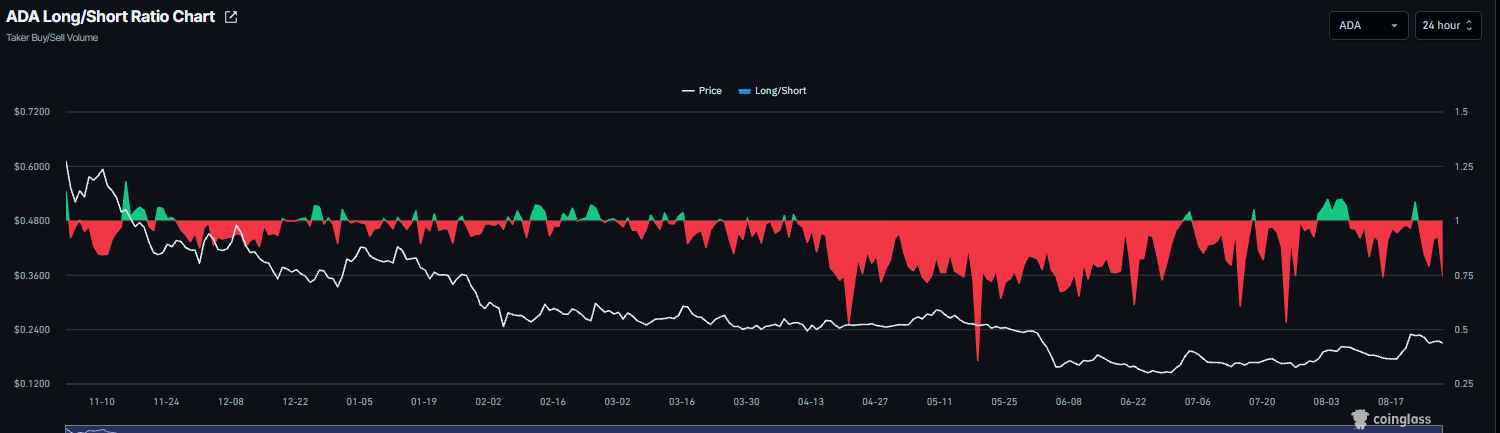
Cardano derivatives and on-chain metrics show a mixed outlook. CoinGlass’ long-to-short ratio for ADA reads 0.74 on Friday, nearing the lowest level over a month. This ratio, below one, reflects bearish sentiment, as more traders are betting the asset’s price will fall.
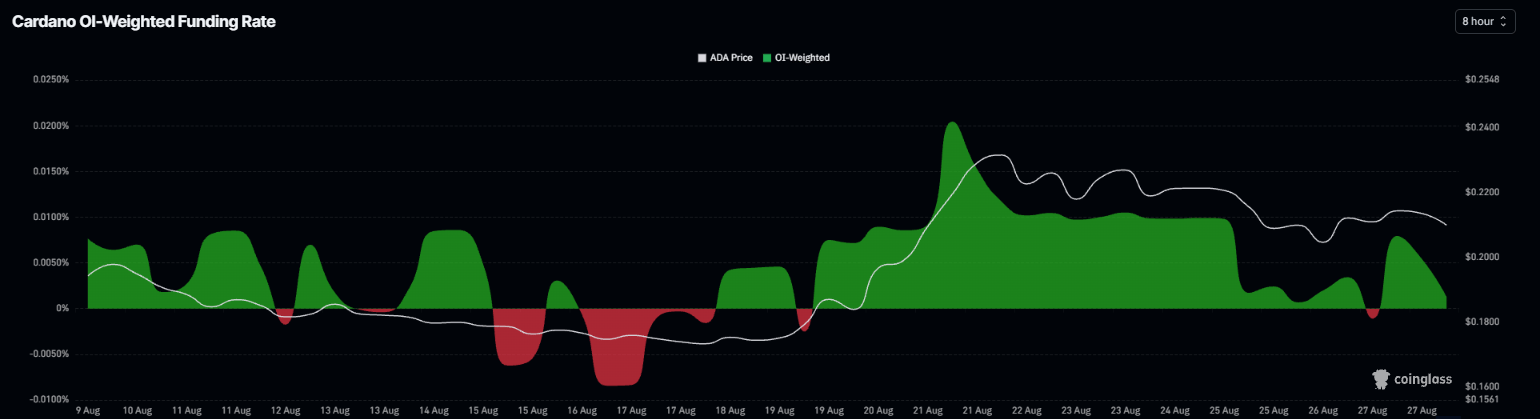
However, the funding rate data shows improving sentiment. CoinGlass’ OI-weighted funding rate data for ADA flipped positive on Thursday, reading 0.0013% on Friday. This positive rate indicates longs are paying shorts and suggests bullish sentiment.
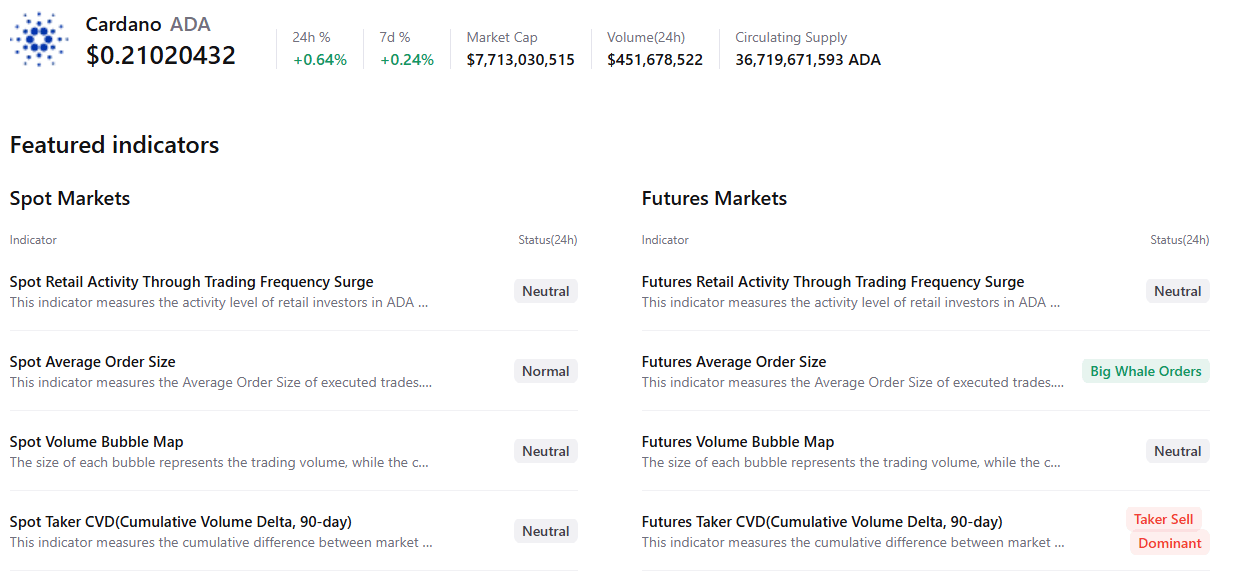
CryptoQuant’s summary data also shows cautious sentiment. ADA’s futures markets show large whale orders, but selling dominates. Other metrics remain neutral, highlighting mixed sentiment among traders.
The above-mentioned combination suggests indecision among Cardano investors and a lack of clear bullish bias.
Cardano technical outlook: Faces rejection from 200-day EMA
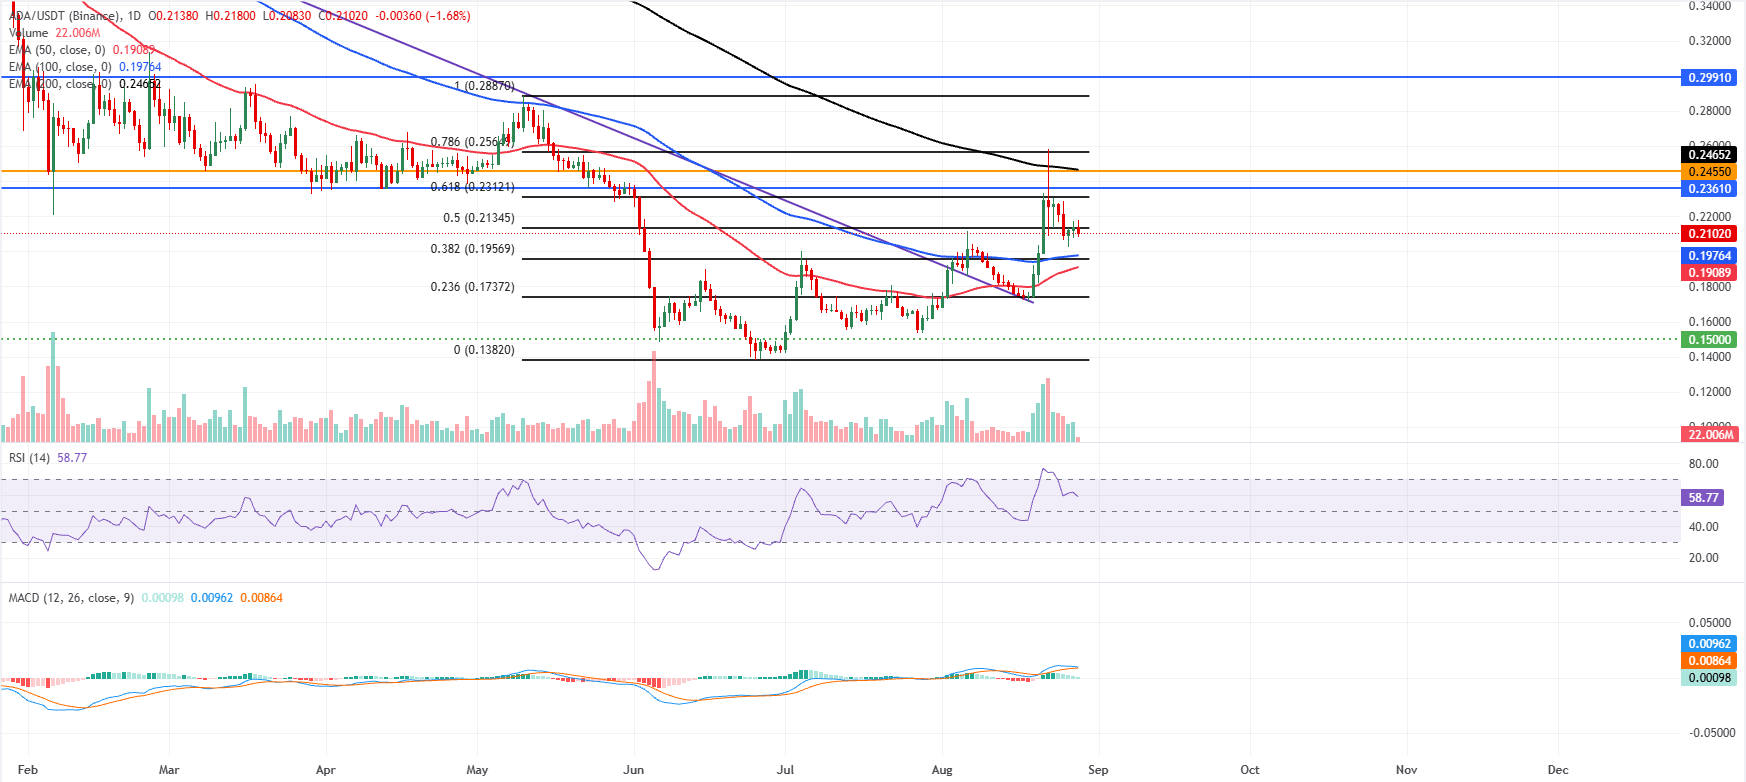
Cardano price trades at $0.210 on Friday after falling over 7% so far this week. ADA has reclaimed the 50-day and 100-day Exponential Moving Averages (EMAs) at $0.190 and $0.197, respectively, tilting the near-term bias slightly bullish while it consolidates below a dense band of overhead resistance.
Momentum is cooling, with the Relative Strength Index (RSI) retreating toward the high-50s and the Moving Average Convergence Divergence (MACD) histogram contracting, which suggests waning upside pressure as price pauses after the recent rebound.
On the topside, initial resistance is aligned with the 50% Fibonacci retracement of the latest downswing at $0.213, followed by the 61.8% Fibonacci retracement level at $0.231 and a horizontal barrier at $0.236. Above these, a broader supply zone emerges between the $0.245 horizontal cap and the 200-day EMA at $0.246.
On the downside, immediate support appears near the 38.2% Fibonacci retracement at $0.195, reinforced by the underlying 50-day and 100-day EMAs, then by the 23.6% Fibonacci retracement at $0.173; a loss of this cluster would expose the stronger structural floor around $0.150.
(The technical analysis of this story was written with the help of an AI tool. Know more.)
Nothing in this material constitutes investment advice, personal recommendation, investment research, an offer, or a solicitation to buy or sell any financial instrument. The content has been prepared without consideration of your individual investment objectives, financial situation, or needs, and should not be treated as such.
Past performance is not a reliable indicator of future performance and/or results. Forward-looking scenarios or forecasts are not a guarantee of future performance. Actual results may differ materially from those anticipated.
Mitrade makes no representation or warranty as to the accuracy or completeness of the information provided and accepts no liability for any loss arising from reliance on such information.
Recommended Articles


