



Solana (SOLUSD) Is down 1.20% on Sep 2: Why It Happened
Solana (SOLUSD) is down 1.20% at Sep 2 04:45(ET), now at $97.92, with a 7-day up of 2.07%.
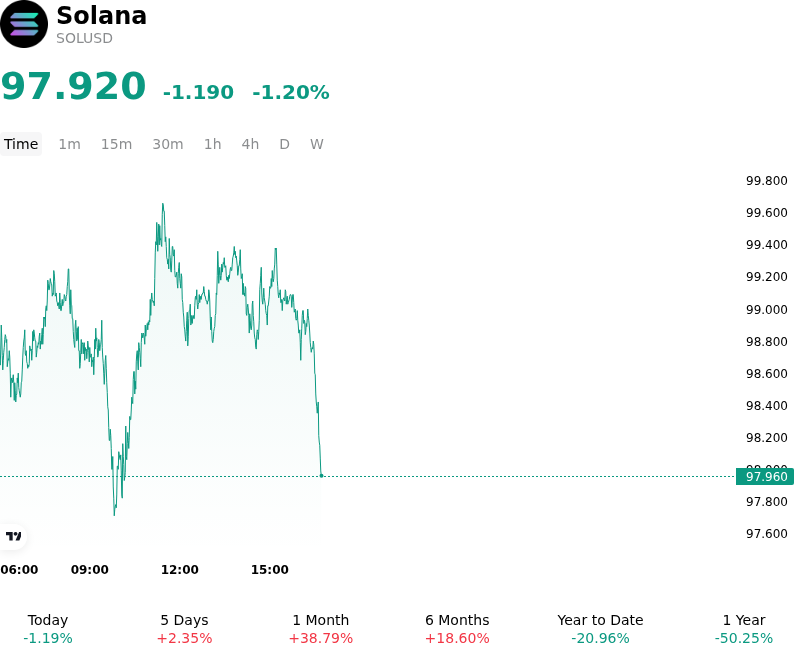
What is driving Solana (SOLUSD)’s stock price down today?
Solana experienced a mild pullback as broader digital asset markets digested tightening macroeconomic conditions and short-term leverage unwinding following a multi-week rally. Heightened uncertainty around Federal Reserve monetary policy, reinforced by recent hawkish commentary from central bank officials, supported US dollar strength and elevated Treasury yields. This macroeconomic backdrop dampened global risk sentiment, prompting institutional and macro-focused traders to temporarily curtail exposure to higher-beta digital assets like SOL.
The modest decline also reflects localized profit-taking and derivative positioning resets after SOL tested key technical resistance following its robust performance throughout late August. While spot Solana ETF vehicle demand and institutional inflows remain structurally supportive over longer horizons, immediate buy-side liquidity showed signs of temporary exhaustion. Derivatives market data indicated a cooling in open interest alongside light liquidations of overextended leveraged long positions, resulting in a liquidity-driven consolidation rather than a fundamental narrative shift.
From a structural perspective, Solana's network fundamentals remain solid, anchored by consistent daily active user metrics, steady real-world asset tokenization inflows, and growing institutional infrastructure adoption. However, near-term capital flows are likely to remain sensitive to macro liquidity dynamics, seasonal portfolio rebalancing, and broader digital asset market risk-appetite adjustments leading into upcoming central bank policy decisions.
Technical Analysis of Solana (SOLUSD)
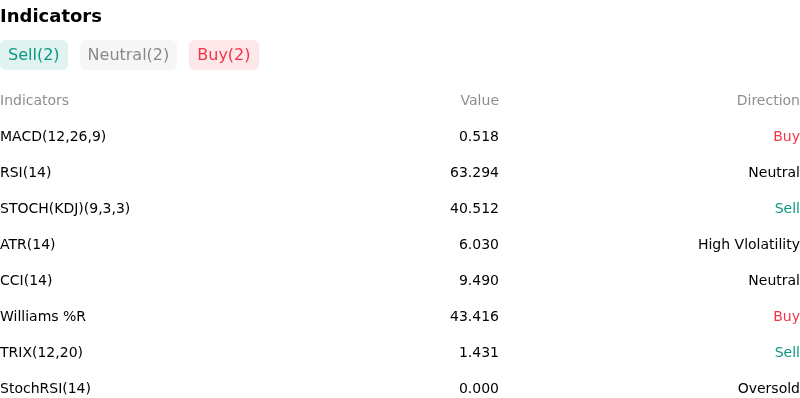
Technically, Solana (SOLUSD) shows a MACD (12,26,9) value of 0.518, indicating a buy signal. The RSI at 63.294 suggests neutral condition and the Williams %R at 43.416 suggests buy condition. Please monitor closely.
More details about Solana (SOLUSD)
Recent Events and Risks:
- Overbought Resistance Rejection at $110: Following a rapid multi-day rally toward the $110 resistance zone, SOLUSD experienced a technical rejection and a corrective drop toward $100. Short-term RSI indicators hit overbought levels, prompting active profit-taking and capping immediate upward momentum.
- Prediction Market Implied Downside Skew: Derivatives and prediction market data on Polymarket show traders pricing in a 67% probability of SOL dropping to $90 during September, with trading volume heavily weighted toward downside threshold contracts compared to upside targets.
- Key Support Fragility and Long Liquidation Risk: SOLUSD is testing critical psychological and technical support around the $100–$103 level. A decisive breakdown below this support pivot risks triggering stop-loss orders and long position liquidations, exposing the asset to lower target levels at $94.40 and $85.79.
- High-Beta Sensitivity to Macro Risk-Off Sentiment: Ongoing macro uncertainties and soft broader crypto market sentiment threaten SOLUSD's near-term stability. Due to Solana's historically high-beta characteristics relative to Bitcoin, any broad risk-off rotation tends to trigger amplified sell-offs in SOL.
Nothing in this material constitutes investment advice, personal recommendation, investment research, an offer, or a solicitation to buy or sell any financial instrument. The content has been prepared without consideration of your individual investment objectives, financial situation, or needs, and should not be treated as such.
Past performance is not a reliable indicator of future performance and/or results. Forward-looking scenarios or forecasts are not a guarantee of future performance. Actual results may differ materially from those anticipated.
Mitrade makes no representation or warranty as to the accuracy or completeness of the information provided and accepts no liability for any loss arising from reliance on such information.
Recommended Articles


