



Ethereum (ETHUSD) Is down 1.11% on Sep 2: Why It Happened
Ethereum (ETHUSD) is down 1.11% at Sep 2 04:50(ET), now at $2392.06, with a 7-day down of 3.15%.
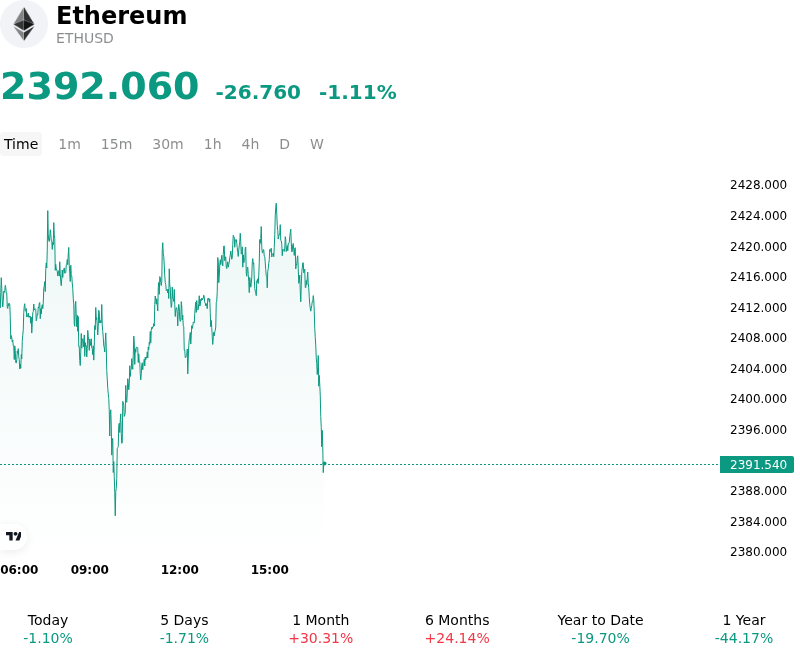
What is driving Ethereum (ETHUSD)’s stock price down today?
The modest pullback in Ethereum reflects a tighter macroeconomic backdrop and a subtle risk-off recalibration across digital assets. A resurgence in US Treasury yields and a firmer US Dollar Index weighed on broad risk appetite as market participants repriced Federal Reserve monetary policy expectations. Inflationary concerns tied to firming energy prices prompted traders to price in a higher probability of extended hawkish policy from the central bank. As risk-free government yields rose, institutional appetite for high-beta digital assets experienced temporary friction, tempering the broader liquidity environment.
Adding to macro headwinds, the underlying buy-side momentum from institutional investment vehicles showed signs of short-term deceleration. Following an aggressive multi-day inflow streak into US spot Ethereum ETFs during late August, net institutional capital inflows moderated from peak daily velocity. Simultaneously, the Coinbase Premium Index turned slightly negative, signaling a brief pause in U.S. institutional spot premium and prompting short-term traders to reduce exposure after the recent recovery rally toward major technical resistance levels.
On-chain capital flows and exchange dynamics further influenced intraday price action. Blockchain tracking data indicated notable wallet transfers moving large blocks of ETH onto centralized exchanges, stoking market concerns regarding localized overhead supply and potential liquidation pressure. In the derivatives market, overbought momentum indicators following late-August upside prompted tactical profit-taking and a slight deleveraging among leveraged long positions. With key technical resistance holding firm, leveraged traders adjusted exposure to mitigate downside risk.
Despite the short-term retracement, Ethereum's structural position remains anchored by substantial network staking activity and broader layer-2 ecosystem utilization. The recent dip appears to represent an event-driven consolidation and liquidity adjustment rather than a fundamental trend reversal. Going forward, institutional investors will continue to monitor Federal Reserve policy signals, spot ETF flow continuity, and overall exchange reserve balances to gauge whether the asset can re-establish upward momentum above key technical support levels.
Technical Analysis of Ethereum (ETHUSD)
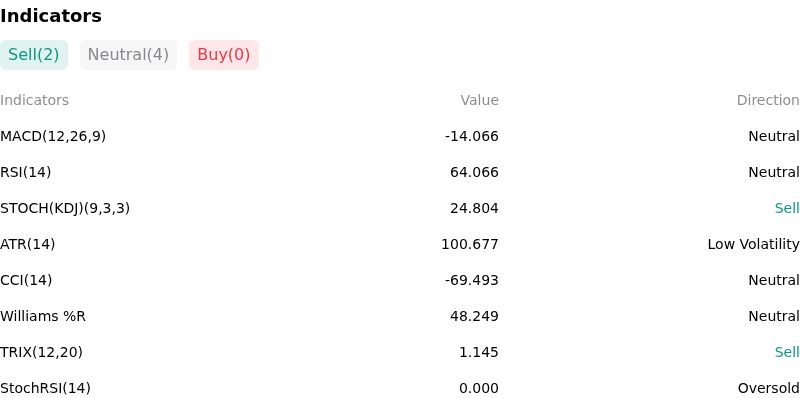
Technically, Ethereum (ETHUSD) shows a MACD (12,26,9) value of -13.794, indicating a neutral signal. The RSI at 64.312 suggests neutral condition and the Williams %R at 47.631 suggests neutral condition. Please monitor closely.
More details about Ethereum (ETHUSD)
Recent Events and Risks:
- Massive Exchange Inflows from Whale Wallets: On-chain tracking over the past 48 hours highlights large-scale whale transfers to centralized trading venues, including a single deposit of 44,126 ETH (over $108 million) to Coinbase and a separate entity moving 70,739 ETH ($174 million) to Binance, OKX, and Bybit out of a $408 million holding. These heavy exchange deposits threaten to thin spot order book liquidity and raise immediate sell-side pressure concerns.
- Overcrowded Leveraged Longs and Liquidation Cascade Risks: Futures market positioning shows severe leverage concentration, with market data estimating roughly $1.08 billion in long liquidations vulnerable if ETH breaches the $2,353–$2,400 support zone. Aggressive leveraged positions—including a $102.3 million 10x long with a liquidation price near $2,241 and a newly opened 25x long on 18,587 ETH—leave market structure highly susceptible to downside volatility and forced liquidations.
- Slowdown in Spot ETF Inflows and Technical Rejection: Net daily capital flows into U.S. spot Ethereum ETFs decelerated sharply from peak figures of $234.5 million down to $87.7 million, accompanied by a near-46% drop in product trading volume. This diminishing institutional demand coincided with ETH failing three consecutive attempts to break overhead technical resistance at $2,542–$2,550, while the Coinbase Premium Index turned negative (-0.014) to signal weakening spot buying.
- Macroeconomic De-Risking and Rising Treasury Yields: Hawkish central bank policy expectations and a surge in U.S. Treasury yields have driven a broader risk-off environment across global financial assets. Rising real yields and U.S. dollar strength are sparking institutional de-risking and liquidity contraction, placing downside pressure on high-beta crypto assets like ETH.
Nothing in this material constitutes investment advice, personal recommendation, investment research, an offer, or a solicitation to buy or sell any financial instrument. The content has been prepared without consideration of your individual investment objectives, financial situation, or needs, and should not be treated as such.
Past performance is not a reliable indicator of future performance and/or results. Forward-looking scenarios or forecasts are not a guarantee of future performance. Actual results may differ materially from those anticipated.
Mitrade makes no representation or warranty as to the accuracy or completeness of the information provided and accepts no liability for any loss arising from reliance on such information.
Recommended Articles


