



Alnylam Pharmaceuticals Inc Stock (ALNY) Moved Up by 7.90% on Sep 2: Facts Behind the Movement
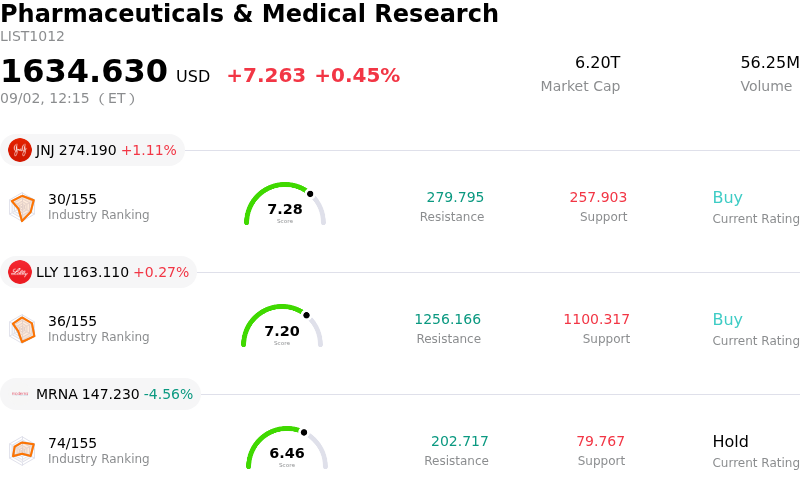
Alnylam Pharmaceuticals Inc (ALNY) moved up by 7.90%. The Pharmaceuticals & Medical Research sector is up by 0.45%. The company outperformed the industry. Top 3 stocks by turnover in the sector: Johnson & Johnson (JNJ) up 1.11%; Eli Lilly and Co (LLY) up 0.27%; Moderna Inc (MRNA) down 4.64%.
What is driving Alnylam Pharmaceuticals Inc (ALNY)’s stock price up today?
Alnylam Pharmaceuticals experienced a sharp upward surge, driven by renewed institutional optimism following comprehensive clinical data presentations at the European Society of Cardiology Congress and subsequent favorable Wall Street analyst commentary. The positive market response reflects growing confidence in the biopharmaceutical firm's core RNA interference therapy, Amvuttra, and its broader cardiovascular pipeline, effectively driving a robust relief rally following a period of post-guidance pressure.
The primary catalyst stems from detailed clinical data disclosures and management updates highlighting the superior efficacy and drug differentiation of Amvuttra. Analysts underscored that Amvuttra demonstrated a higher degree of transthyretin knockdown compared to competing antisense treatments, while consistently achieving key clinical endpoints in its pivotal Phase 3 HELIOS-B study. Furthermore, favorable subgroup analyses reinforced the therapy's strong profile as a leading first-line treatment option for transthyretin amyloid cardiomyopathy. This reaffirmed competitive moat helped dispel recent market anxieties surrounding potential competitive threats in the RNA silencer market.
A flurry of bullish sell-side research notes further accelerated buying momentum. Multiple major investment research firms reiterated positive ratings, citing the fundamental strength of the company's RNA interference platform, upcoming trial milestones for next-generation candidates like nucresiran, and expansion opportunities into high-prevalence cardiovascular indications such as uncontrolled hypertension. The broad analyst reaffirmation provided institutional investors with enhanced visibility regarding long-term therapeutic adoption and revenue durability, sparking significant buying interest.
Looking forward, market participants will remain focused on commercial execution, payer reimbursement dynamics, and upcoming institutional investor conferences. While competitive developments and previous revenue guidance adjustments remain relevant factors, the strong clinical validation and analyst support substantially reinforce the company's position as a dominant pioneer in RNAi therapeutics.
Technical Analysis of Alnylam Pharmaceuticals Inc (ALNY)
Technically, Alnylam Pharmaceuticals Inc (ALNY) shows a MACD (12,26,9) value of 10.007, indicating a neutral signal. The RSI at 62.760 suggests neutral condition and the Williams %R at 7.244 suggests overbought condition. Please monitor closely.
Fundamental Analysis of Alnylam Pharmaceuticals Inc (ALNY)
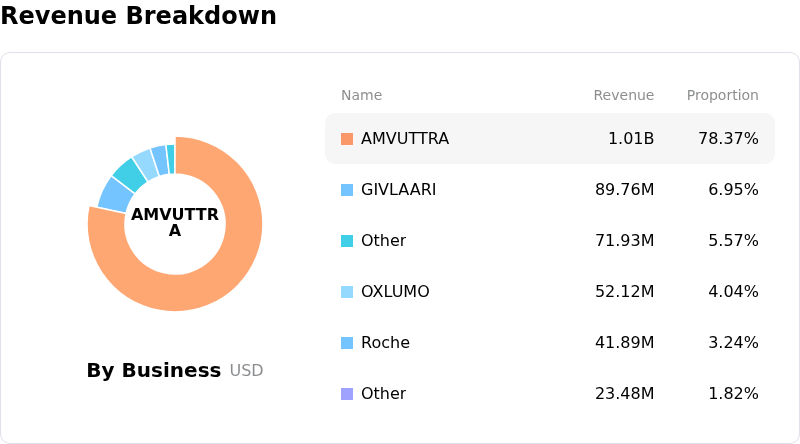
Alnylam Pharmaceuticals Inc (ALNY) is in the Pharmaceuticals & Medical Research industry. Its latest annual revenue is $3.71B, ranking 32 in the industry. The net profit is $313.75M, ranking 34 in the industry. Company Profile
Over the past month, multiple analysts have rated the company as Buy, with an average price target of $370.26, a high of $566.00, and a low of $230.00.
More details about Alnylam Pharmaceuticals Inc (ALNY)
Company Specific Risks:
- TTR Product Franchise Guidance Reduction: Management lowered full-year 2026 net product sales guidance for flagship TTR therapies (AMVUTTRA and Onpattro) by approximately $200 million, acknowledging that early post-launch adoption was driven by transient pent-up demand that has since normalized below prior market expectations.
- Competitive Pressures from ESC Congress Clinical Data: Detailed presentation of competing Phase 3 trial data (including Ionis and AstraZeneca's eplontersen) at the ESC Congress 2026 has heightened investor scrutiny over RNAi silencer durability versus protein stabilizers, threatening AMVUTTRA's long-term market share trajectory in ATTR-CM.
- Securities Litigation and Shareholder Probes: Multiple class action law firms, including Kirby McInerney LLP and Kessler Topaz Meltzer & Check, LLP, have launched investigations into potential federal securities law violations following the sudden share price collapse prompted by management's commercial outlook revisions.
- Valuation Compression Risk: Trading at a trailing price-to-earnings ratio near 40x—significantly above the biotech industry average of 16x—the stock faces ongoing multiple compression risk from institutional analysts as growth rates moderate toward sector averages.
Nothing in this material constitutes investment advice, personal recommendation, investment research, an offer, or a solicitation to buy or sell any financial instrument. The content has been prepared without consideration of your individual investment objectives, financial situation, or needs, and should not be treated as such.
Past performance is not a reliable indicator of future performance and/or results. Forward-looking scenarios or forecasts are not a guarantee of future performance. Actual results may differ materially from those anticipated.
Mitrade makes no representation or warranty as to the accuracy or completeness of the information provided and accepts no liability for any loss arising from reliance on such information.
Recommended Articles


