



S&P Global Inc Stock (SPGI) Moved Up by 3.43% on Sep 3: Key Drivers Unveiled
S&P Global Inc (SPGI) moved up by 3.43%. The Industrial & Commercial Services sector is up by 1.50%. The company outperformed the industry. Top 3 stocks by turnover in the sector: Nebius Group NV (NBIS) up 1.88%; S&P Global Inc (SPGI) up 3.44%; PayPal Holdings Inc (PYPL) up 1.94%.
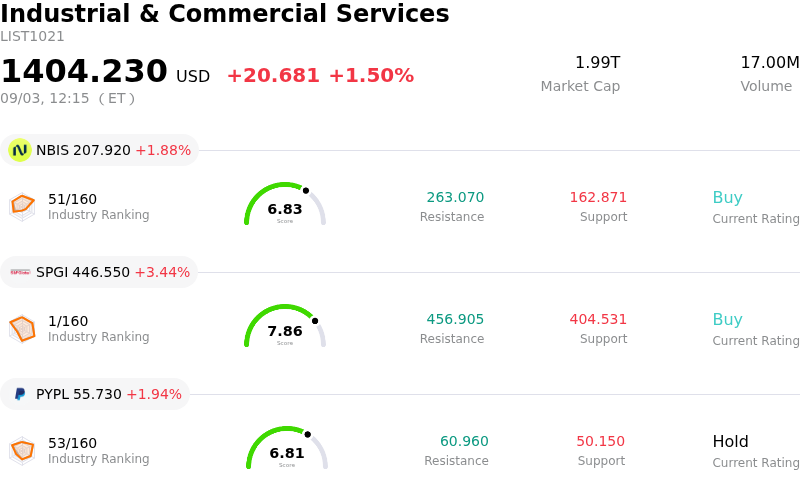
What is driving S&P Global Inc (SPGI)’s stock price up today?
S&P Global experienced notable upward momentum driven by heightened investor optimism surrounding potential corporate restructuring moves. Market sentiment was boosted by reports that the financial information giant is evaluating strategic options for its Market Intelligence segment, including a potential spin-off of its flagship Capital IQ Pro data and analytics platform. Following the successful spin-out of its Mobility unit, this prospective transaction underscores management's aggressive pivot toward streamlining portfolio assets and eliminating non-core operational friction. Investors responded enthusiastically to the prospect of creating a standalone data entity, which could highlight hidden intrinsic value within the market intelligence division.
Wall Street reaction to the potential divestment has been overwhelmingly positive, providing additional tailwinds for the stock. Institutional equity research firms highlighted that carving out the desktop data business would leave S&P Global as a leaner, higher-margin entity focused on its dominant credit ratings, index, and core benchmarking businesses. Analysts noted that such a move could effectively narrow the company's historical valuation discount relative to high-growth financial technology and information peers. Furthermore, recent institutional accumulation, including high-profile hedge fund positioning and positive valuation assessments citing solid intrinsic value upside, reinforced buying pressure among institutional market participants.
Beyond structural catalysts, S&P Global continues to benefit from steady demand across its core ratings and benchmark solutions amid evolving macroeconomic conditions. While broader equity markets experienced intraday volatility, S&P Global demonstrated resilience supported by durable subscription revenues and expanding integration of artificial intelligence tools across client workflows. Looking ahead, market participants will be closely monitoring official management commentary regarding the execution timeline of the potential Capital IQ Pro separation, alongside corporate debt issuance trends, as the company seeks to unlock long-term shareholder value through disciplined capital allocation.
Technical Analysis of S&P Global Inc (SPGI)
Technically, S&P Global Inc (SPGI) shows a MACD (12,26,9) value of 3.819, indicating a buy signal. The RSI at 61.087 suggests neutral condition and the Williams %R at 18.200 suggests overbought condition. Please monitor closely.
Media Coverage of S&P Global Inc (SPGI)
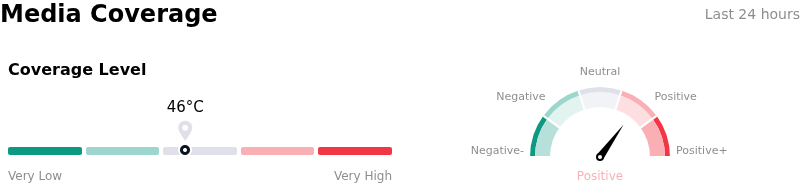
In terms of media coverage, S&P Global Inc (SPGI) shows a coverage score of 46, indicating a moderate level of media attention. The overall market sentiment index is currently in bullish zone.
Fundamental Analysis of S&P Global Inc (SPGI)
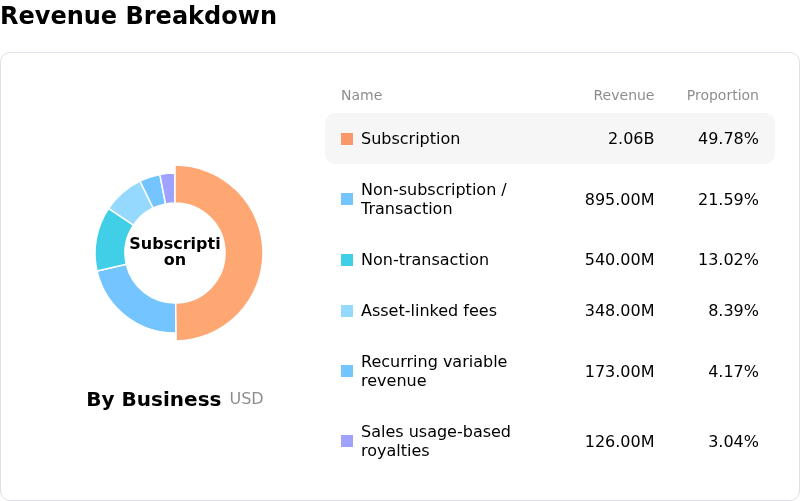
S&P Global Inc (SPGI) is in the Industrial & Commercial Services industry. Its latest annual revenue is $15.34B, ranking 8 in the industry. The net profit is $4.47B, ranking 2 in the industry. Company Profile
Over the past month, multiple analysts have rated the company as Buy, with an average price target of $525.21, a high of $629.00, and a low of $485.00.
More details about S&P Global Inc (SPGI)
Company Specific Risks:
- Capital IQ Pro Spinoff Disruption and Execution Risks: Recent reports indicating S&P Global is evaluating a multibillion-dollar spinoff of its Capital IQ Pro desktop and data platform—coming shortly after the July 2026 separation of its Mobility division—have raised analyst concerns over heightened structural complexity, lack of transaction details, and operational disruption across its core Market Intelligence segment.
- Contract Renewal Friction and Margin Concessions: Geopolitical conflicts in key regional energy markets continue to complicate enterprise contract renewals with major institutional clients, forcing management to offer price concessions and flexible terms that compress operating margins.
- Earnings Guidance Downgrades and Ratings Headwinds: Reduced full-year 2026 revenue growth guidance (trimmed to 5.9%–7.9%) driven by sluggishness in the Energy segment and subdued corporate debt issuance reflects persistent top-line growth pressure.
- Valuation Premium and AI Data Commoditization Threat: Institutional analysts highlight valuation risk as the stock trades well above conservative narrative fair-value models, compounded by investor anxiety that generative AI solutions could commoditize financial data and erode the company's long-term competitive moat.
Nothing in this material constitutes investment advice, personal recommendation, investment research, an offer, or a solicitation to buy or sell any financial instrument. The content has been prepared without consideration of your individual investment objectives, financial situation, or needs, and should not be treated as such.
Past performance is not a reliable indicator of future performance and/or results. Forward-looking scenarios or forecasts are not a guarantee of future performance. Actual results may differ materially from those anticipated.
Mitrade makes no representation or warranty as to the accuracy or completeness of the information provided and accepts no liability for any loss arising from reliance on such information.
Recommended Articles


