



USD/CAD (USDCAD) Surges 0.50% on Sep 4: What Does the Market Value?
USD/CAD (USDCAD) is up 0.50% at Sep 4 08:40(ET), now at $1.38617, with a 7-day down of 0.27%.
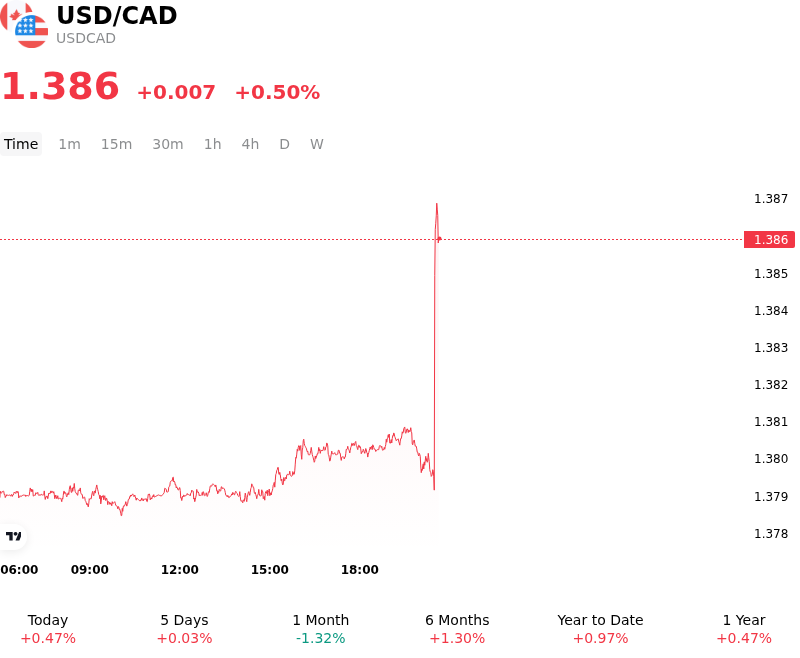
What is driving USD/CAD (USDCAD)’s stock price up today?
The advance in USDCAD was driven primarily by a sharp divergence in labor market data from the United States and Canada, which prompted a swift repricing of short-term interest-rate expectations. United States nonfarm payrolls for August unexpectedly surged well past market estimates, pointing to sustained resilience in the labor market. The stronger-than-expected print pushed U.S. Treasury yields higher across the curve as market participants reduced bets on near-term Federal Reserve policy easing, providing immediate upward momentum to the U.S. dollar.
In contrast, the Canadian dollar faced persistent headwinds following a weaker-than-anticipated domestic employment report. Canadian payrolls contracted during August, driven largely by a decline in full-time jobs. This sudden weakness highlighted domestic growth risks and the lingering drag from elevated trade policy uncertainty. The disappointing employment data bolstered expectations that the Bank of Canada will keep its policy rate anchored or face pressure to adopt a more accommodative stance, further dampening investor demand for the Loonie.
The resulting widening of U.S.-Canada interest rate differentials, coupled with contrasting economic growth outlooks, reinforced capital flows into the greenback over the Canadian dollar. While firm energy prices provided a modest buffer for commodity-linked currencies, the macro divergence in North American labor dynamics proved to be the dominant driver. The upward shift in the pair represents a fundamentally backed move aligned with shifting monetary policy trajectories and relative yield spreads.
Technical Analysis of USD/CAD (USDCAD)
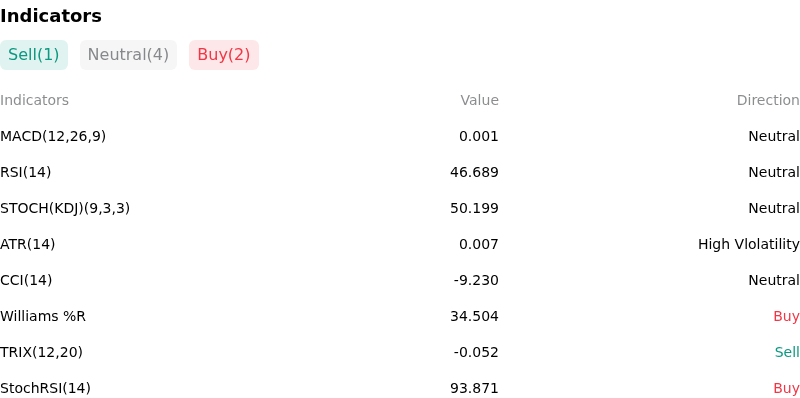
Technically, USD/CAD (USDCAD) shows a MACD (12,26,9) value of 0.001, indicating a neutral signal. The RSI at 44.950 suggests neutral condition and the Williams %R at 42.685 suggests buy condition. Please monitor closely.
More details about USD/CAD (USDCAD)
Recent Events and Risks:
- Hawkish Bank of Canada Policy Shift: The Bank of Canada held its overnight policy rate at 2.25% but adopted a markedly hawkish tone, warning that upside risks to inflation are building near 3.00% due to trade friction and energy prices. Governor Tiff Macklem's emphasis on inflation persistence has prompted markets to price in a higher rate path, driving downside volatility in USDCAD.
- Crude Oil Price Rally and Energy Terms-of-Trade Support: WTI crude oil prices surged toward multi-week highs near $95 per barrel amid escalating geopolitical tensions and maritime disruptions in the Strait of Hormuz. As a primary crude exporter, Canada benefits from boosted energy terms of trade, putting sustained downward pressure on the USD/CAD exchange rate.
- Unwinding USD Carry Trade and Softening US Bond Yields: Broad-based US dollar weakness accelerated after soft US ADP employment data and dovish comments from Federal Reserve Governor Christopher Waller reduced Fed rate expectations. Lower US Treasury yields have narrowed the US-Canada yield differential, exposing long USD/CAD carry positions to sharp liquidation risk.
- High-Impact Dual Labor Market Event Risk: Market participants are bracing for heightened intraday volatility around the simultaneous release of US Non-Farm Payrolls and Canadian monthly employment reports. Any combination of disappointing US job growth and a positive Canadian labor surprise risks triggering stop-loss cascades below the key 1.3800 technical support level.
Nothing in this material constitutes investment advice, personal recommendation, investment research, an offer, or a solicitation to buy or sell any financial instrument. The content has been prepared without consideration of your individual investment objectives, financial situation, or needs, and should not be treated as such.
Past performance is not a reliable indicator of future performance and/or results. Forward-looking scenarios or forecasts are not a guarantee of future performance. Actual results may differ materially from those anticipated.
Mitrade makes no representation or warranty as to the accuracy or completeness of the information provided and accepts no liability for any loss arising from reliance on such information.
Recommended Articles


