



Zcash Price Forecast: Rally hits nine-year high above $1,000 amid growing shielded demand
- Zcash trades above $1,000 on Friday, building on its 16% gain from the previous day.
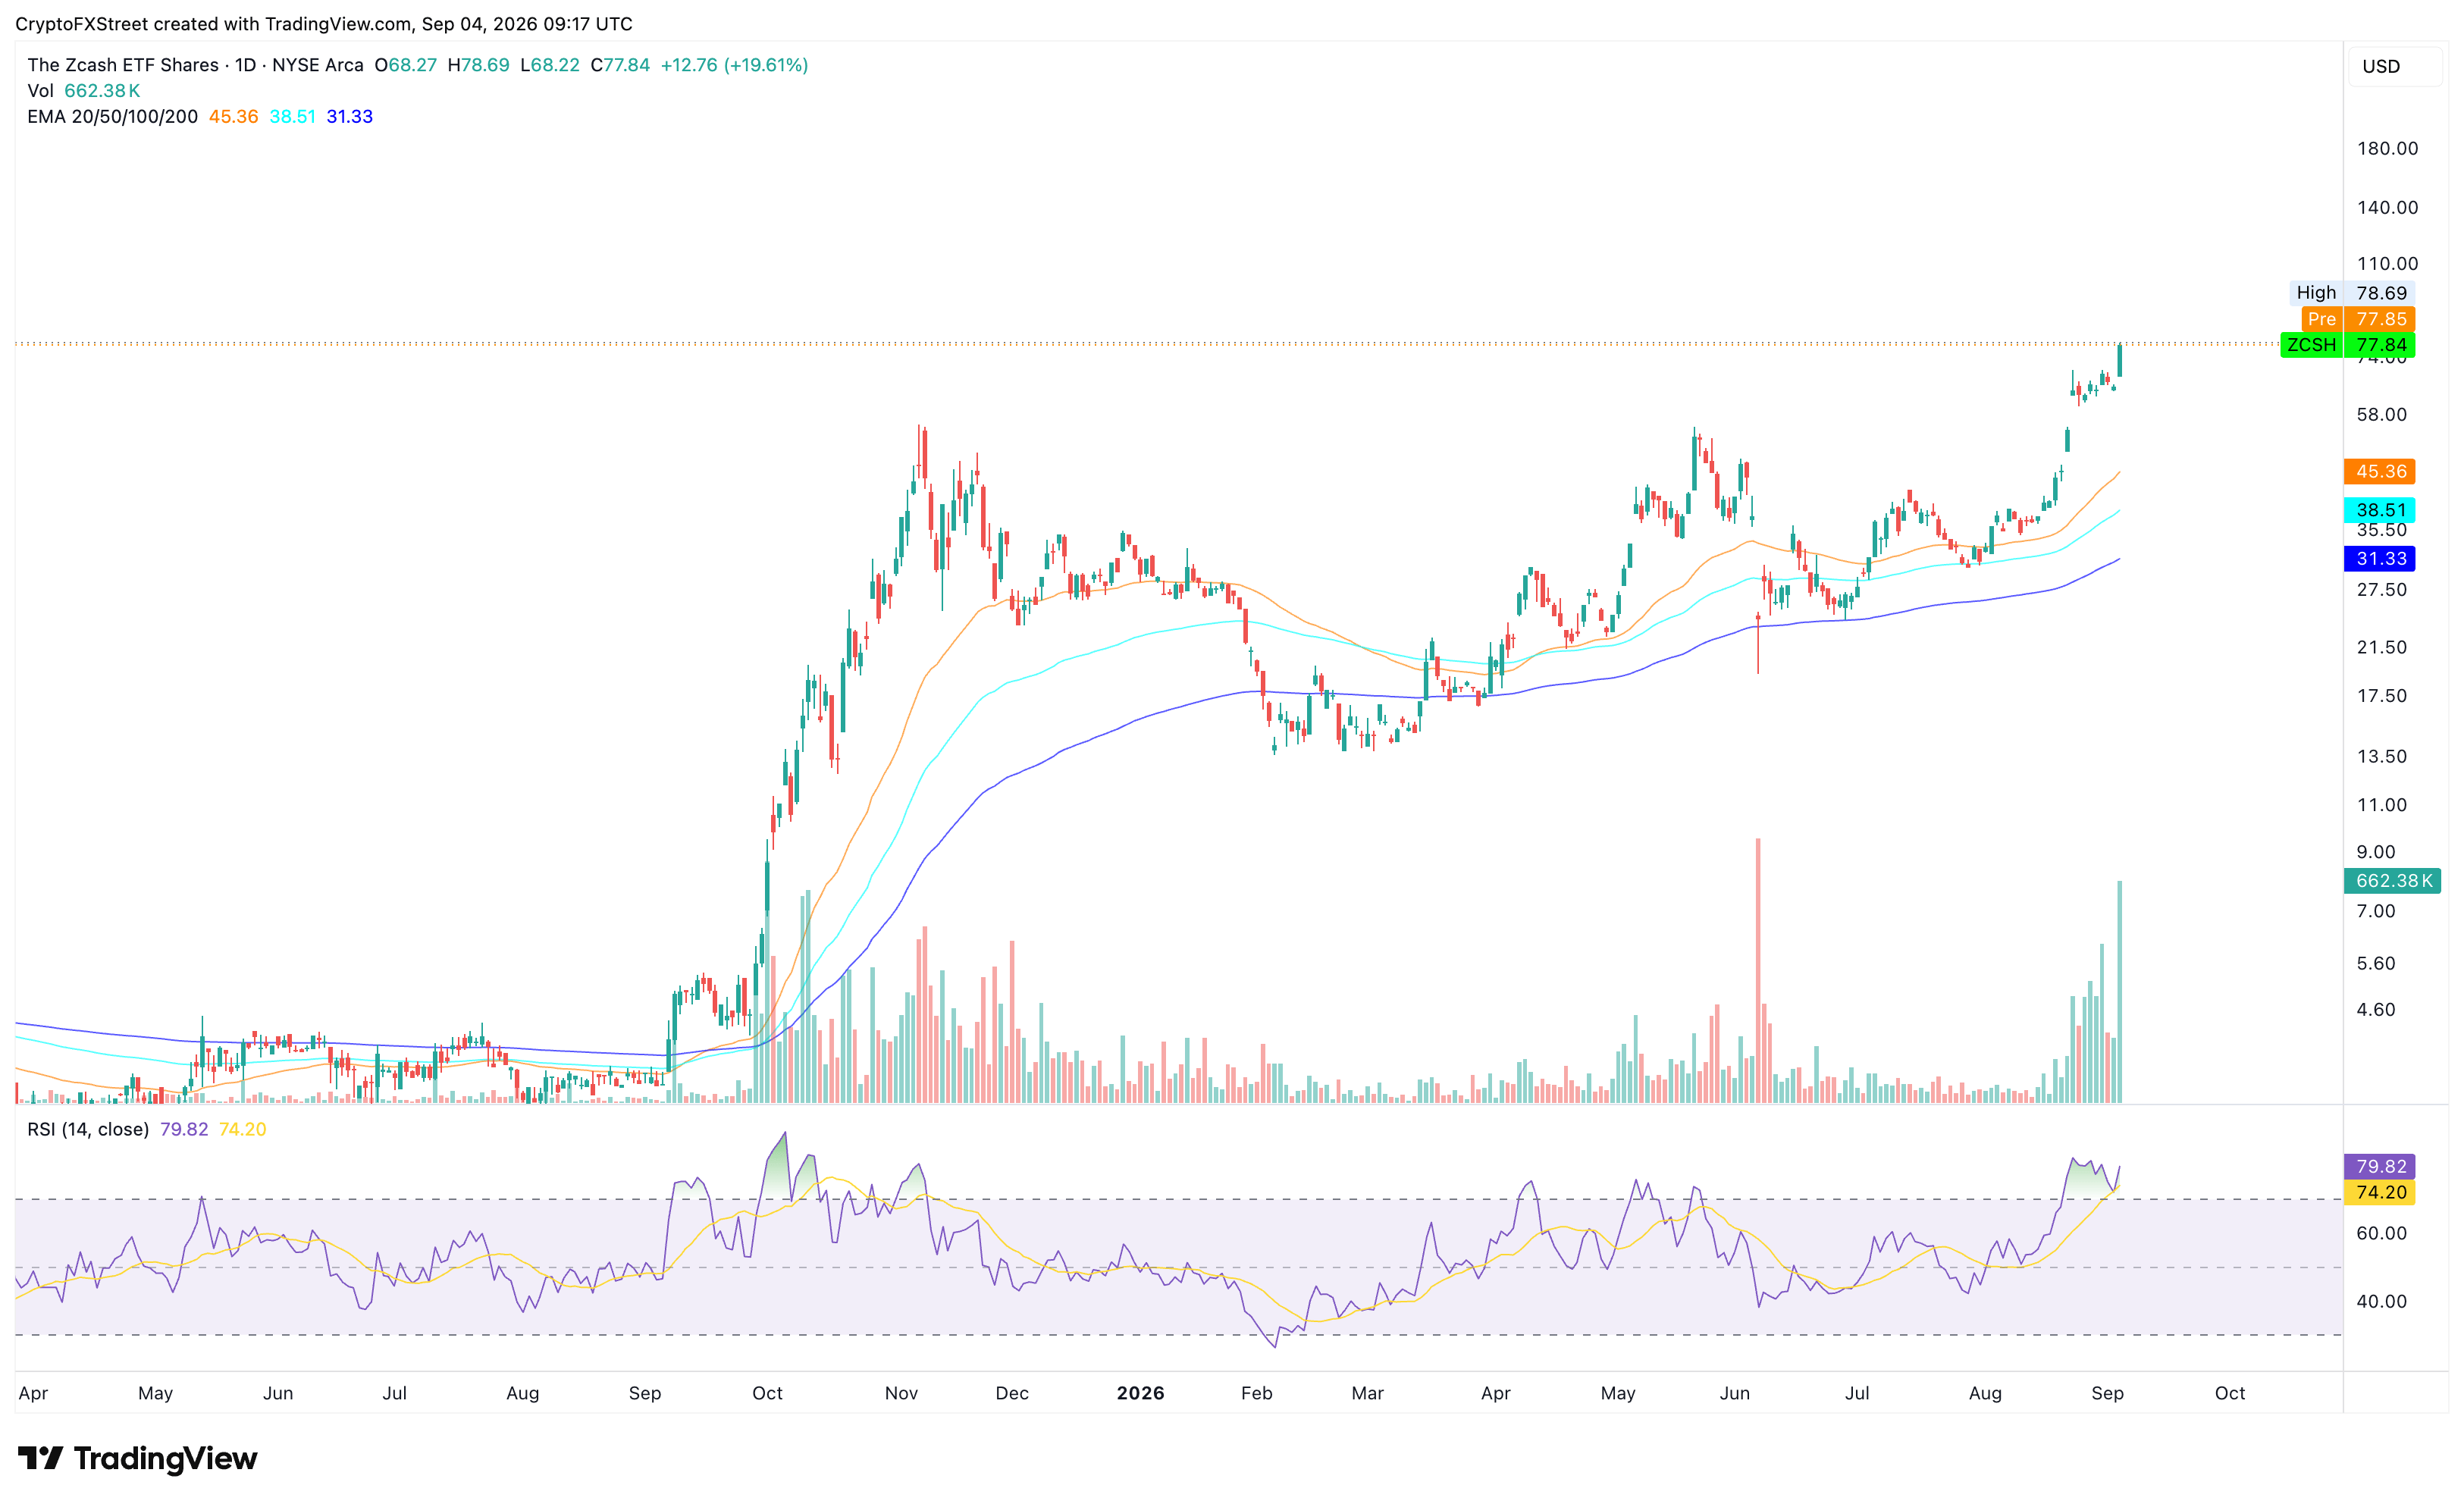
- Grayscale’s Zcash ETF trades above $77 at a record high, signaling firm institutional demand.
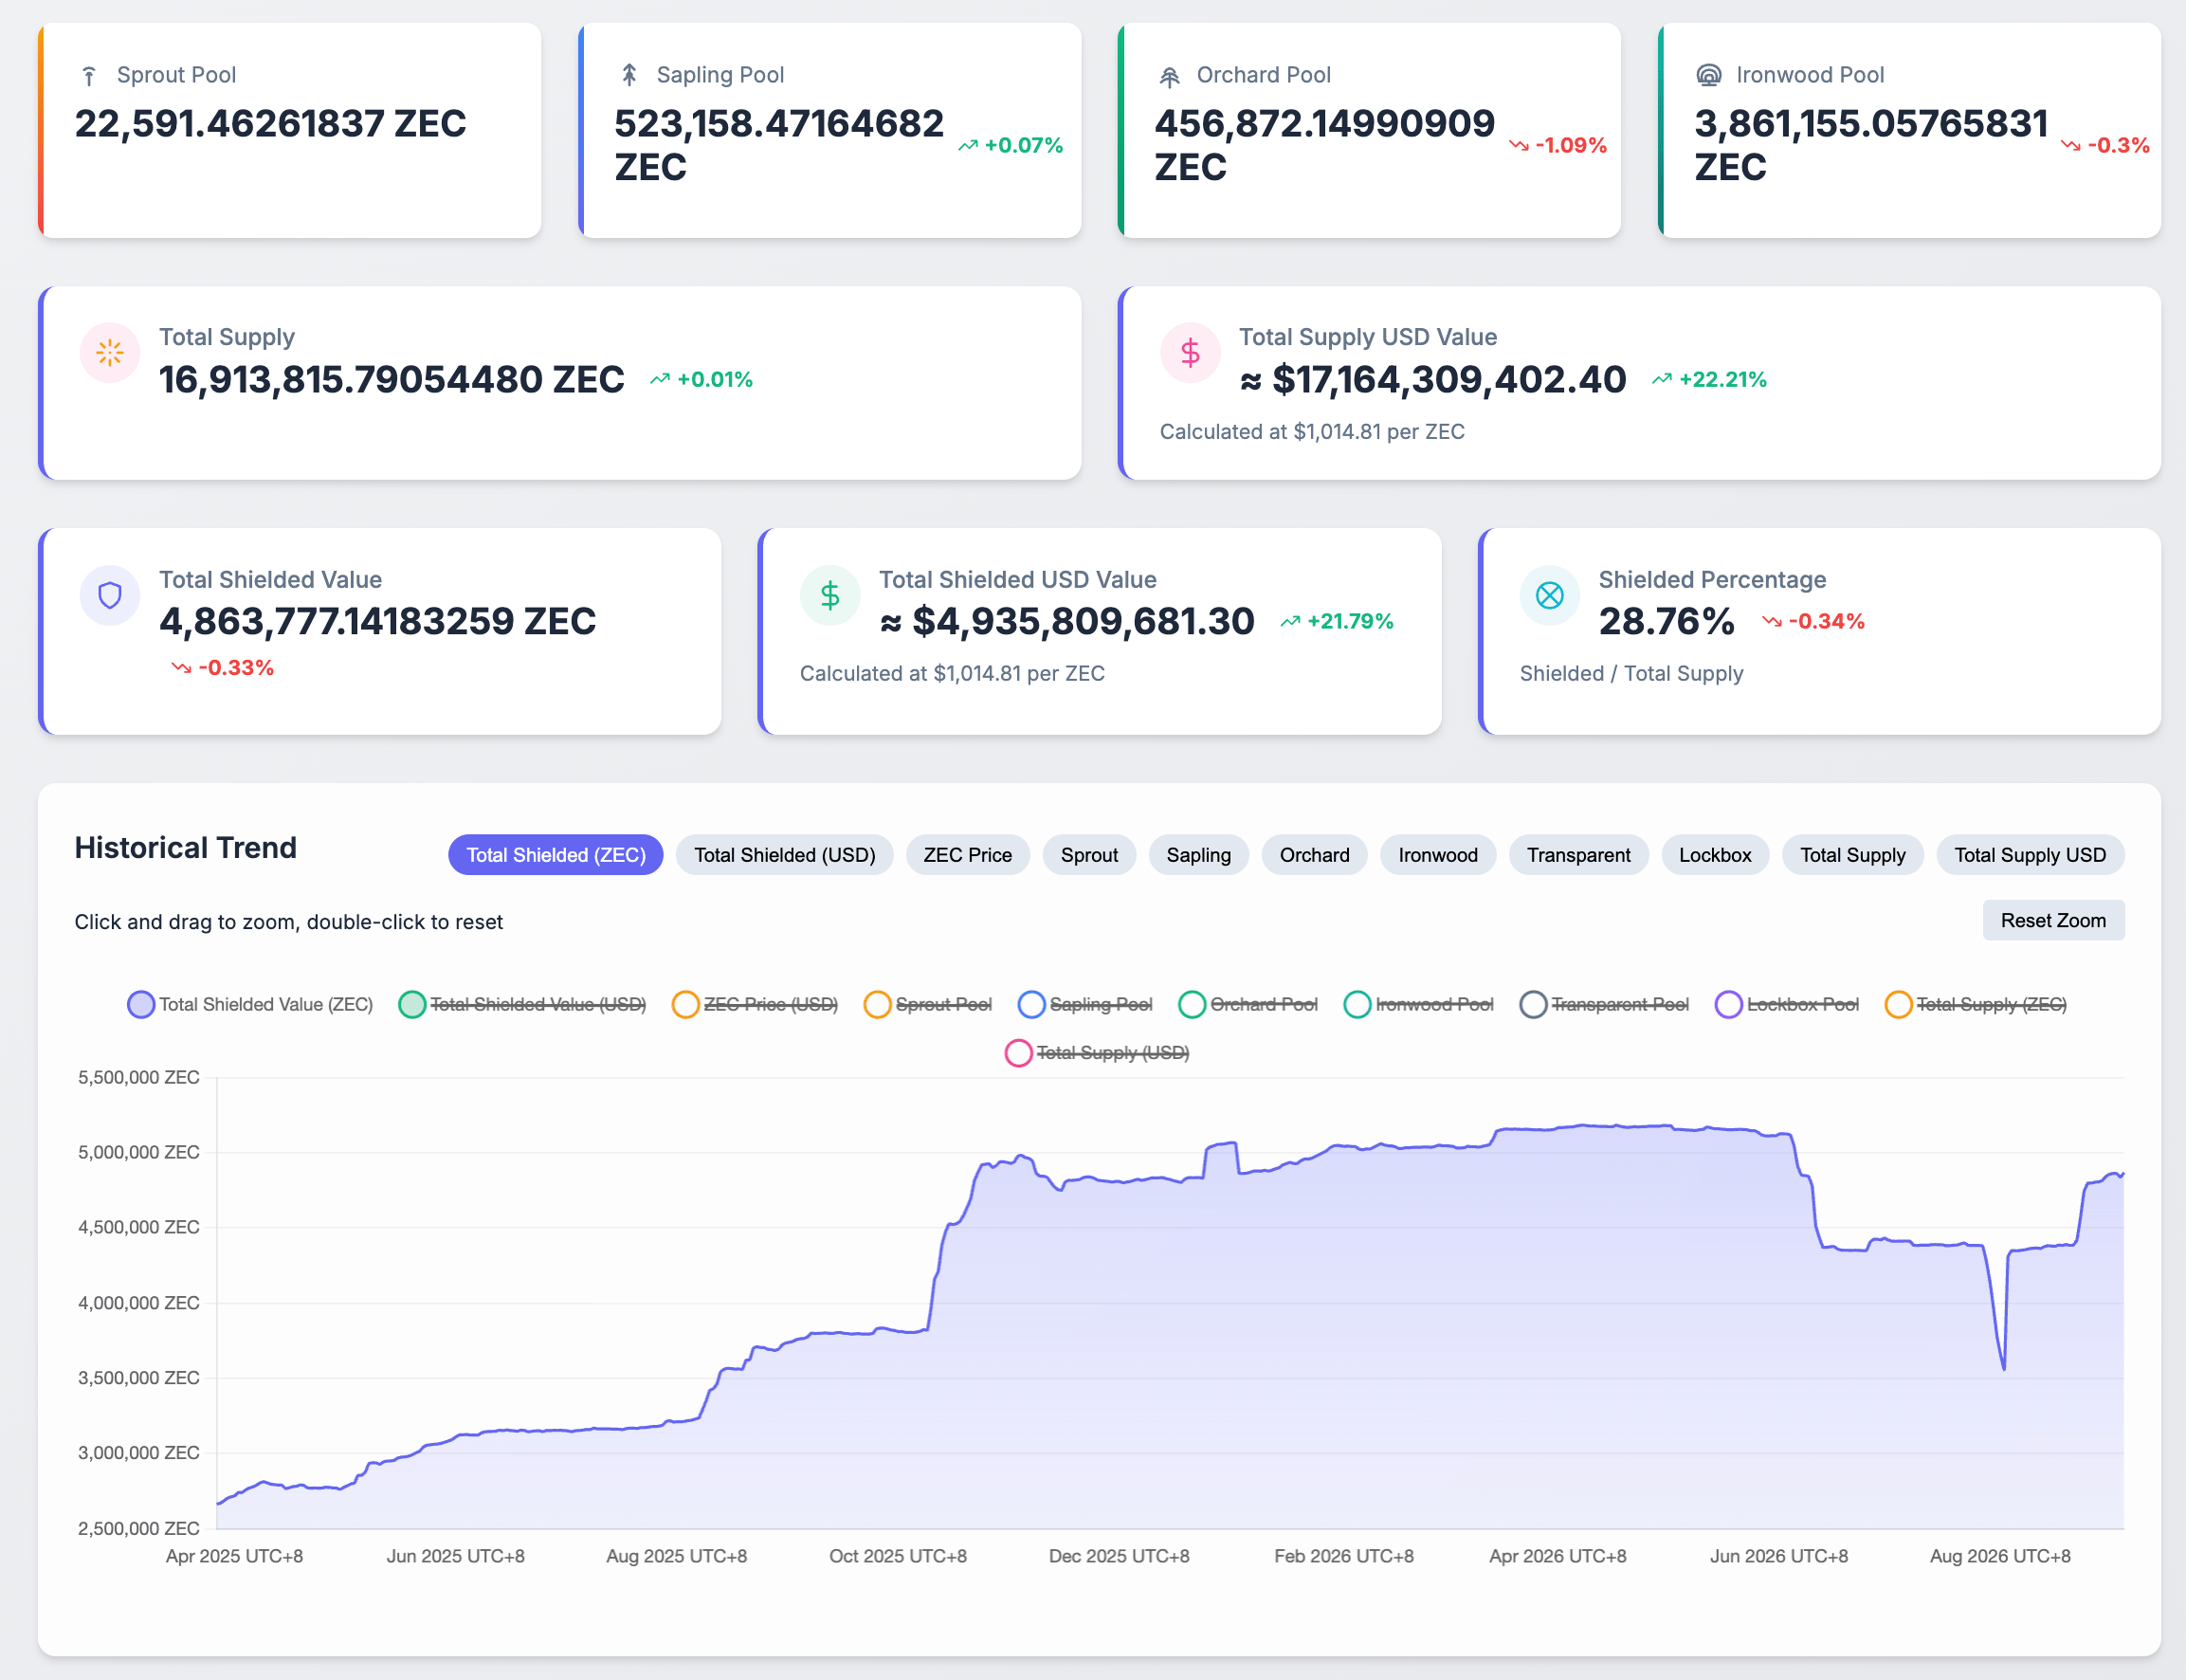
- On-chain data show a steady increase in shielded supply to 4.86 million ZEC tokens, pointing to growing demand for privacy.
Zcash (ZEC) rally advances above $1,000 on Friday, maintaining its strong bullish momentum. Institutional demand for Zcash holds firm, with Grayscale’s ZEC-focused Exchange-Traded Fund (ETF) rising to a record high, while its shielded supply has risen to 4.86 million tokens, pointing to growing user demand.
Demand for Zcash keeps rising
Zcash emerges as a top-performing cryptocurrency, with 95% gains so far in 2026, advancing last year’s more than 800% rally. Grayscale’s Zcash ETF (ZCSH) is up 25% since its listing on the New York Stock Exchange (NYSE) Arca on August 25 and reached a new record high of $80.17 in Friday’s pre-market session.
At the same time, the demand for Zcash’s privacy feature is rising, with the total shielded supply reaching 4.86 million ZEC tokens, accounting for 28.76% of the total supply. The majority of the shielded supply, 3.86 million ZEC tokens, is stored in the Ironwood Pool, its most secure pool with independent audits and quantum-recoverable note formats.
In addition, Vizor wallet recently successfully signed a shielded transaction directly on a Ledger hardware wallet, pointing to a complete Ledger implementation in development for Zcash's private transactions.

Technical outlook: Zcash rally gains bullish momentum
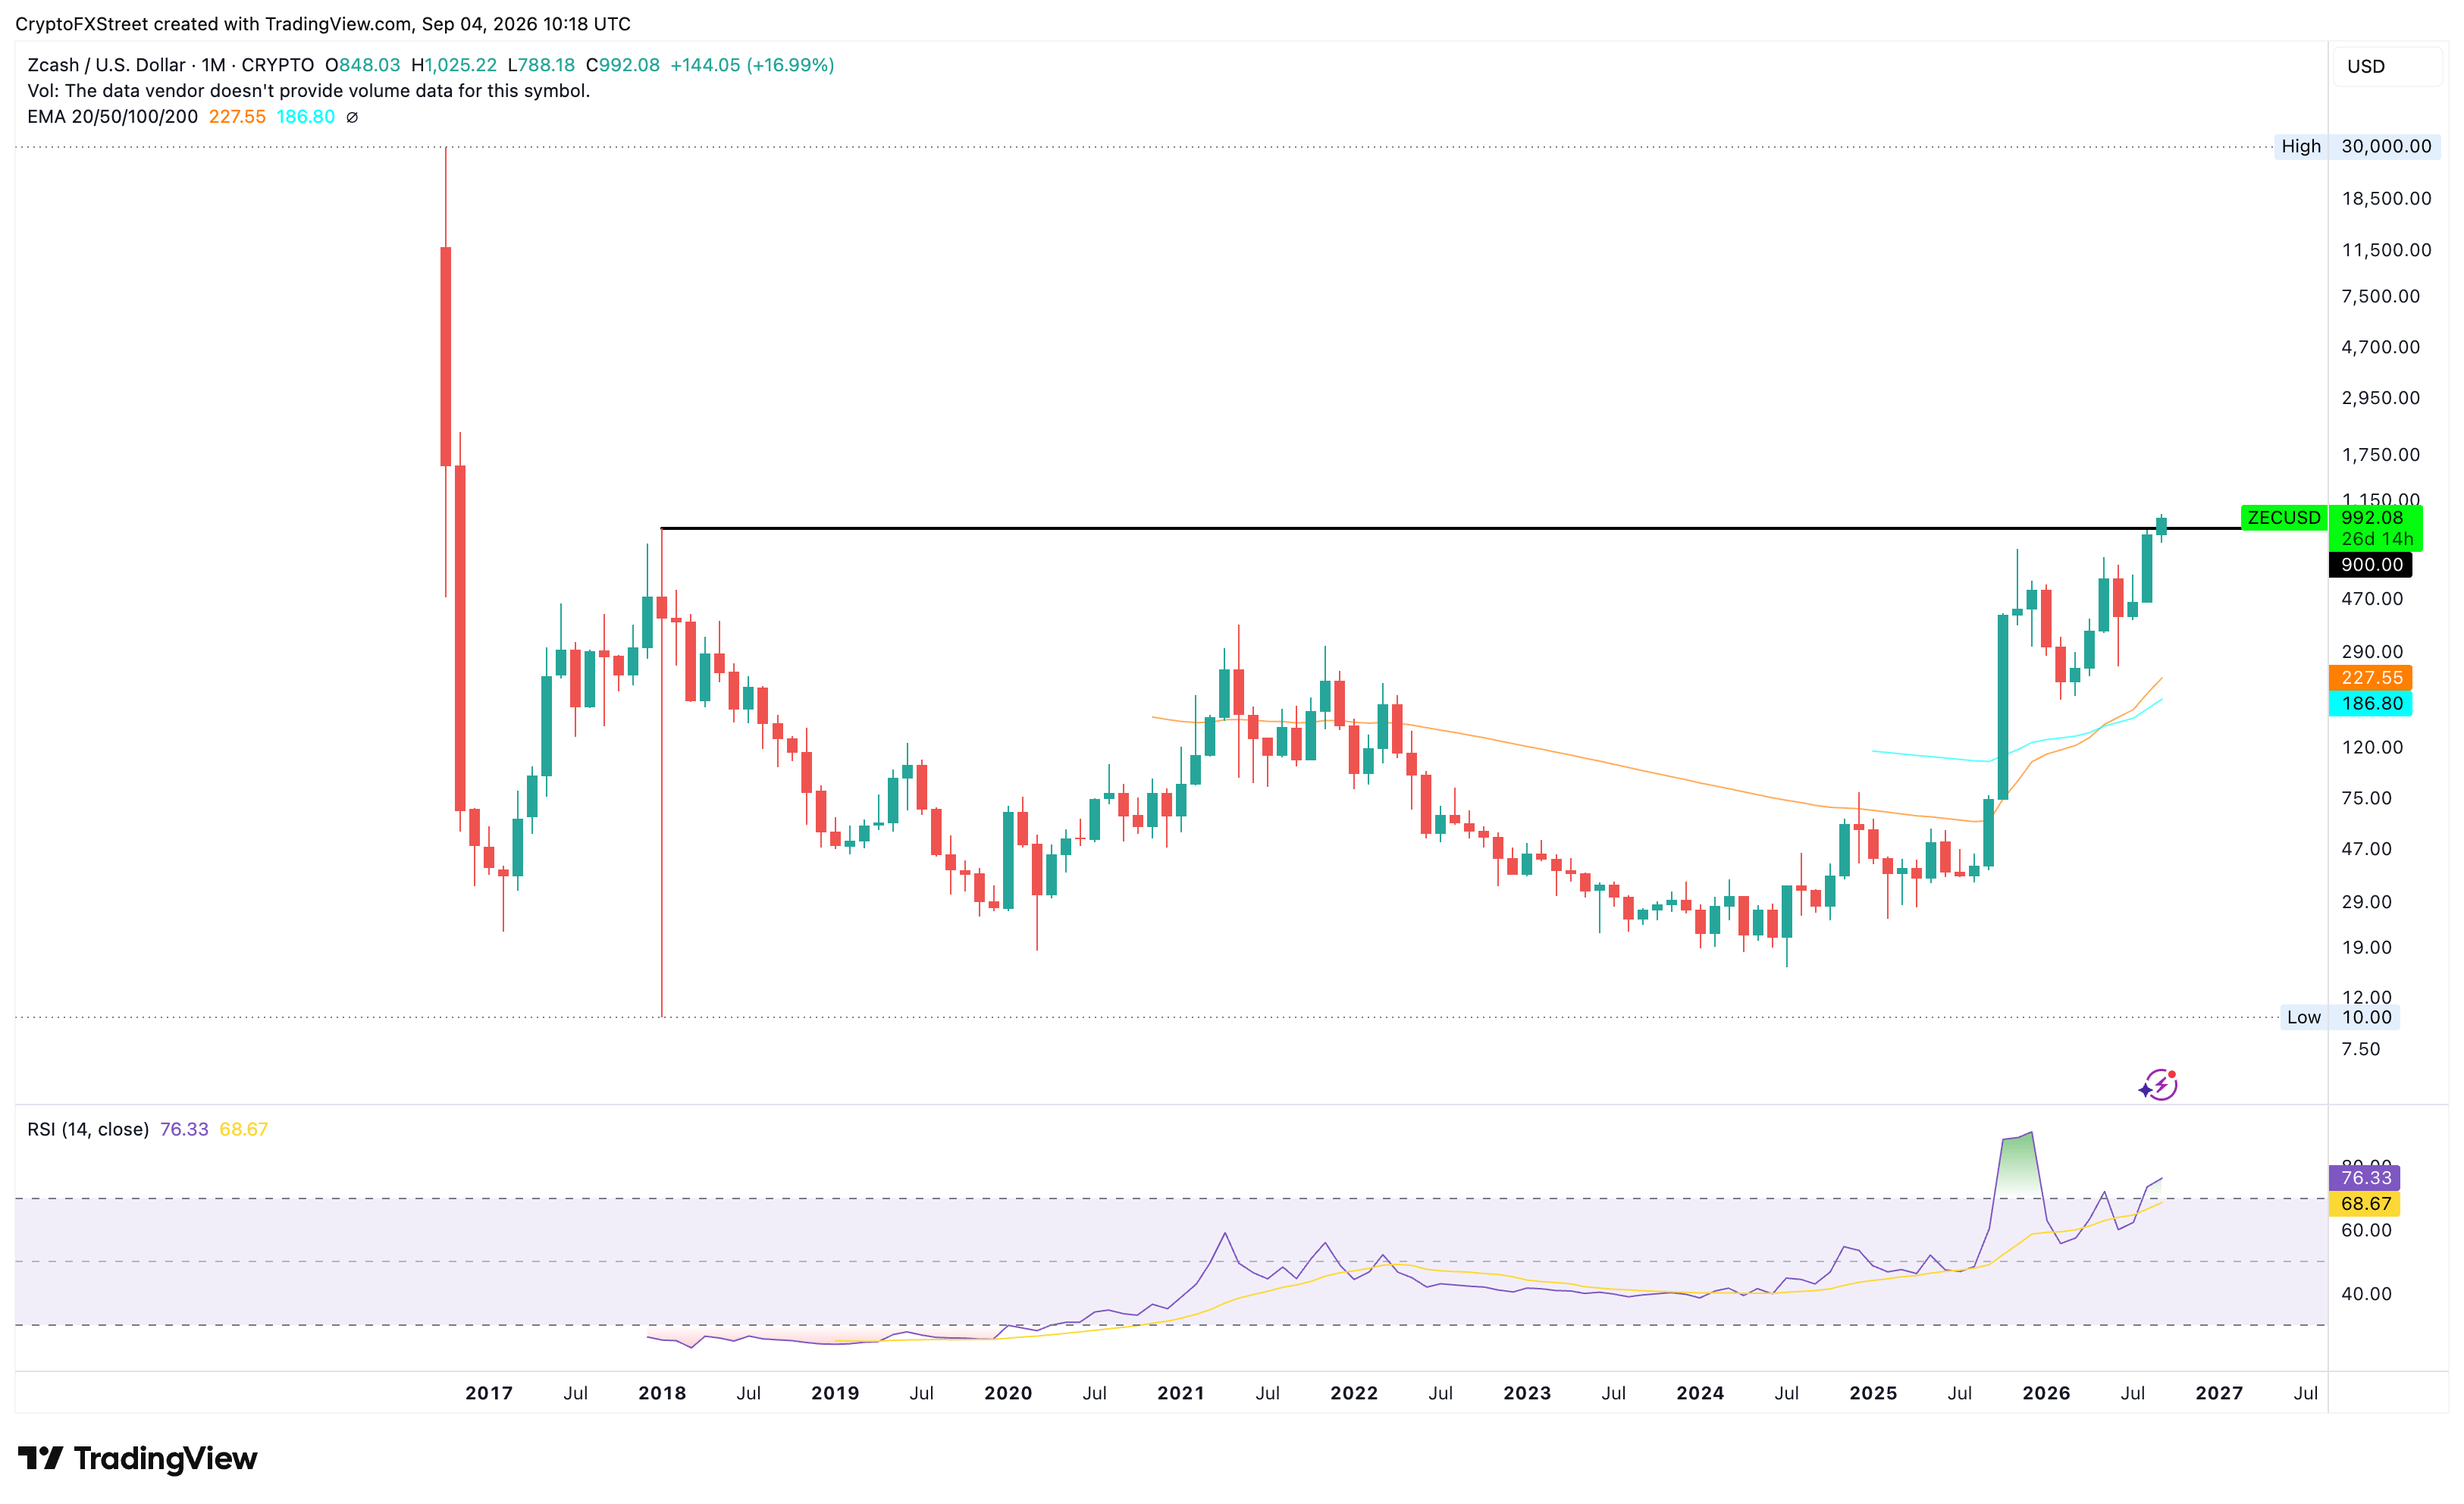
Zcash trades around $1,000 on Friday, extending a bullish near-term bias as price hits a nine-year high after surpassing the January 2018 high of $900. Still, the privacy coin remains well below its all-time high of $30,000 recorded during its initial listing, driven by extreme market hype and artificially induced supply scarcity.
On the 4-hour chart, Zcash inches toward the 127.2% Fibonacci extension level measured over the $465 to $888 upswing, at $1,058. A confirmed breakout above $1,058 could target the 161.8% Fibonacci extension level at $1,322.
The 50-period EMA around $845, together with the 100- and 200-period EMAs down at $780 and $689, respectively, underlines a firmly supported structure. Momentum remains strong, with the Relative Strength Index (RSI) hovering in overbought territory near 76 on the same chart, while the Moving Average Convergence Divergence (MACD) rises in positive territory, suggesting that bullish pressure is still in play.
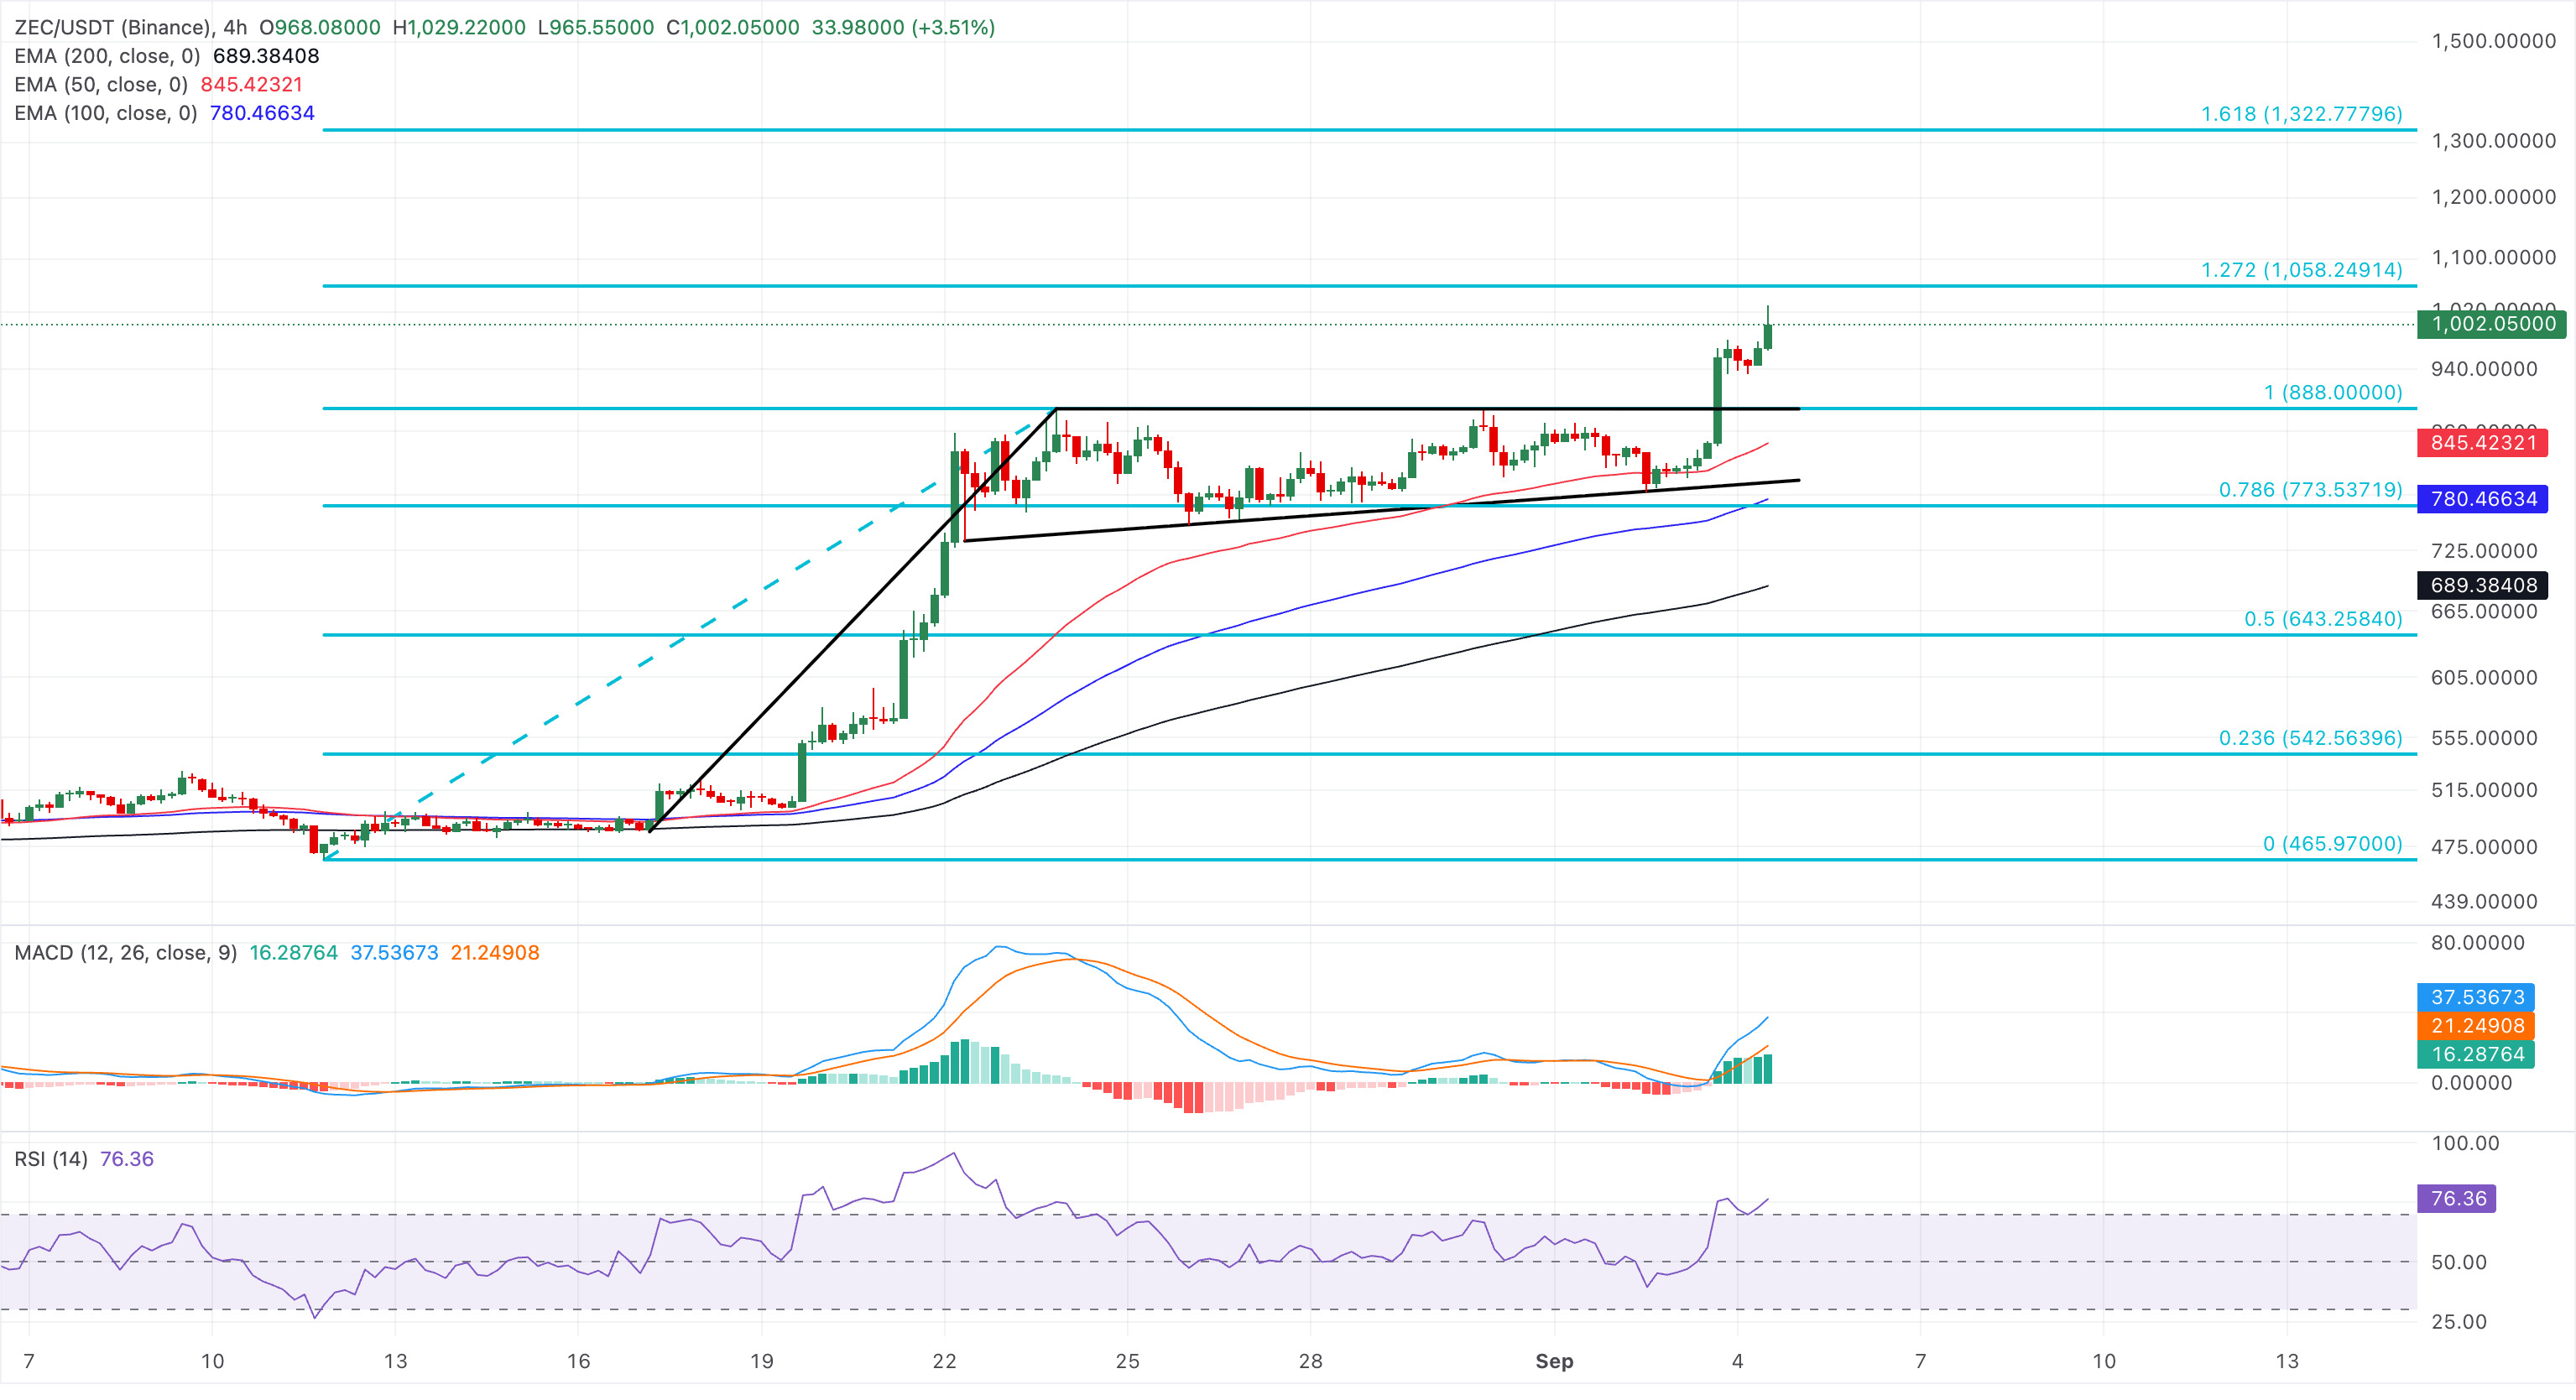
On the downside, initial protection emerges at the reclaimed Fibonacci anchor of $888, followed by the 50-period EMA at $845 and the 78.6% Fibonacci retracement at $773.
(The technical analysis of this story was written with the help of an AI tool. Know more.)
Nothing in this material constitutes investment advice, personal recommendation, investment research, an offer, or a solicitation to buy or sell any financial instrument. The content has been prepared without consideration of your individual investment objectives, financial situation, or needs, and should not be treated as such.
Past performance is not a reliable indicator of future performance and/or results. Forward-looking scenarios or forecasts are not a guarantee of future performance. Actual results may differ materially from those anticipated.
Mitrade makes no representation or warranty as to the accuracy or completeness of the information provided and accepts no liability for any loss arising from reliance on such information.
Recommended Articles


