



Solana (SOLUSD) Is up 1.31% on Sep 18: Why It Happened
Solana (SOLUSD) is up 1.31% at Sep 18 21:50(ET), now at $101.6, with a 7-day up of 0.13%.
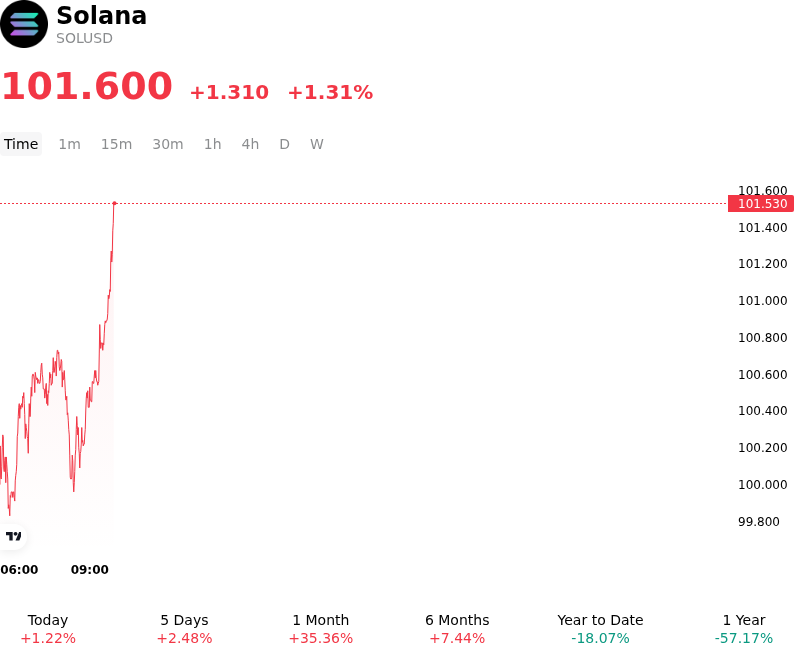
What is driving Solana (SOLUSD)’s stock price up today?
Capital flowed into Solana as institutional investors responded positively to network-specific technical developments and steady structural adoption, outweighing broader macroeconomic noise following the Federal Reserve's recent policy update. Regulatory momentum surrounding digital asset investment vehicles has continued to anchor long-term sentiment, with Solana benefiting from established regulatory frameworks and spot ETF access that simplify capital deployment for institutional participants. Continuous baseline inflows into asset management products and resilient liquidity across trading venues provided a steady bid for SOL, allowing the asset to absorb macro interest rate head-winds and re-establish upward price momentum.
A primary catalyst driving intraday upside was progress on core protocol infrastructure, highlighted by the mainnet activation of reduced block slot times designed to optimize network finality toward 200 milliseconds. This continuous engineering upgrade directly enhances execution speed and network capacity, strengthening Solana's competitive positioning for high-frequency trading venues and decentralized finance applications. Concurrently, expanding enterprise integration—demonstrated by commercial banking platforms incorporating Solana's low-latency settlement layer for 24/7 stablecoin clearing—further reinforced long-term fundamental demand for SOL as both a fee layer and staking asset.
From a market structure perspective, the advance was supported by favorable derivatives positioning and strong spot trading activity across decentralized applications. As short positions were forced to unwind around key support levels, market depth improved and perpetual funding rates stabilized in positive territory. While broader macroeconomic conditions and ongoing legislative debates surrounding market structure remain key external risks for digital assets, Solana's intraday strength demonstrates robust institutional interest driven by concrete network performance upgrades, expanding real-world settlement utility, and healthy ecosystem liquidity.
Technical Analysis of Solana (SOLUSD)
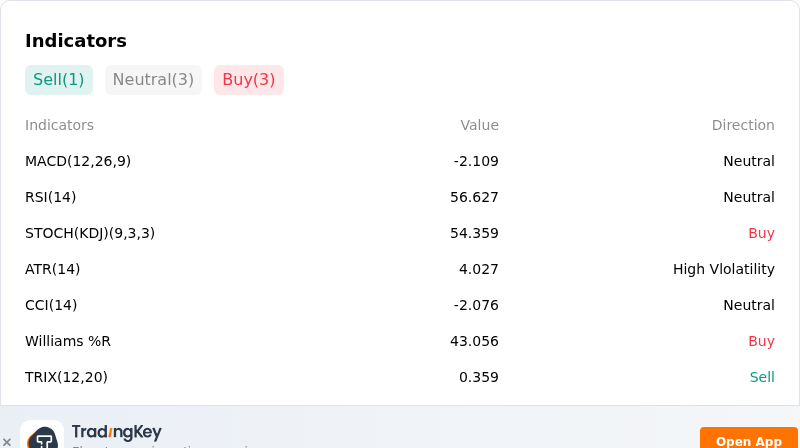
Technically, Solana (SOLUSD) shows a MACD (12,26,9) value of -2.109, indicating a neutral signal. The RSI at 56.627 suggests neutral condition and the Williams %R at 43.056 suggests buy condition. Please monitor closely.
More details about Solana (SOLUSD)
Recent Events and Risks:
- Macro and Regulatory Pressure: Recent US legislative delays surrounding digital asset regulatory frameworks, combined with rising Treasury yields and Federal Reserve rate-hike concerns, have triggered a broad risk-off sell-off across high-beta altcoins including SOL.
- Technical Support Breakdown: SOL lost crucial support at the $100 psychological boundary and the $103 cost-basis cluster, with bearish moving-average crossovers exposing the asset to potential acceleration down toward the $94.16 and $92.00 support levels.
- Overcrowded Long Positioning and Liquidation Risk: Futures positioning remains heavily skewed toward longs, leaving market structure vulnerable to rapid stop-loss triggers and liquidation cascades if spot prices continue to drift lower.
- Decelerating Institutional Inflows and Unlocked Supply: Spot ETF inflows have slowed significantly relative to prior breakout periods, while protocol updates like the SIMD-0437 rent reduction unlocked over 600,000 SOL into circulating supply, creating potential overhead sell pressure.
Nothing in this material constitutes investment advice, personal recommendation, investment research, an offer, or a solicitation to buy or sell any financial instrument. The content has been prepared without consideration of your individual investment objectives, financial situation, or needs, and should not be treated as such.
Past performance is not a reliable indicator of future performance and/or results. Forward-looking scenarios or forecasts are not a guarantee of future performance. Actual results may differ materially from those anticipated.
Mitrade makes no representation or warranty as to the accuracy or completeness of the information provided and accepts no liability for any loss arising from reliance on such information.
Recommended Articles


