



ConocoPhillips Stock (COP) Moved Down by 3.41% on Sep 21: Key Drivers Unveiled
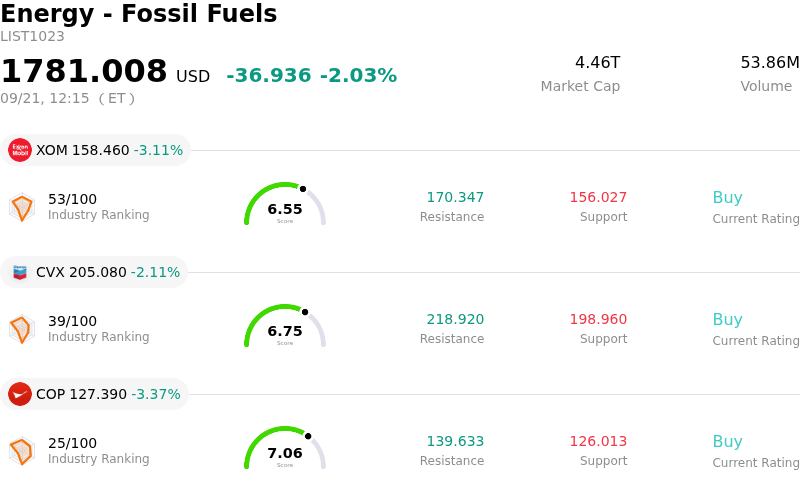
ConocoPhillips (COP) moved down by 3.41%. The Energy - Fossil Fuels sector is down by 2.03%. The company underperformed the industry. Top 3 stocks by turnover in the sector: Exxon Mobil Corp (XOM) down 3.11%; Chevron Corp (CVX) down 2.11%; ConocoPhillips (COP) down 3.35%.
What is driving ConocoPhillips (COP)’s stock price down today?
ConocoPhillips experienced downward pressure and heightened volatility primarily driven by a sharp pullback in underlying crude oil prices. Benchmark crude futures extended their decline as global supply fears receded. Reports of rising oil tanker shipments through key maritime chokepoints in the Middle East, coupled with progress on pipeline infrastructure restoration and active diplomatic dialogues, eased short-term supply disruption premiums. As an exploration and production pure-play, ConocoPhillips' revenue and free cash flow generation are tightly tied to global oil price benchmarks, making its equity particularly sensitive to pullbacks in crude futures.
The broader energy sector faced widespread profit-taking following a period of strong year-to-date outperformance. Macroeconomic headwinds, including elevated real Treasury yields and a resilient U.S. dollar, further dampened risk appetite for commodity-linked equities. Institutional repositioning away from energy assets toward broader equity markets compounded the sell-off. Additionally, technical profit-taking contributed to intraday selling momentum after the stock traded near multi-month highs, triggering automated and systematic risk management responses.
From a fundamental perspective, investors continue to weigh ConocoPhillips' operational execution against near-term macro volatility. While the company maintains a robust balance sheet, disciplined capital return policies, and long-term growth catalysts across its global liquefied natural gas portfolio and major development projects, its corporate cash breakeven level leaves near-term earnings sensitive to benchmark crude volatility. In the absence of company-specific positive catalysts, macro-driven commodity weakness remains the dominant force behind the stock's downward movement.
Technical Analysis of ConocoPhillips (COP)
Technically, ConocoPhillips (COP) shows a MACD (12,26,9) value of -2.782, indicating a neutral signal. The RSI at 43.057 suggests neutral condition and the Williams %R at 98.955 suggests oversold condition. Please monitor closely.
Media Coverage of ConocoPhillips (COP)
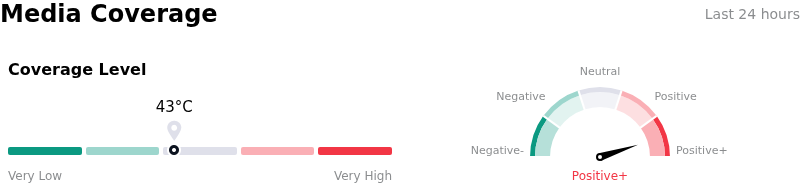
In terms of media coverage, ConocoPhillips (COP) shows a coverage score of 43, indicating a moderate level of media attention. The overall market sentiment index is currently in extremely bullish zone.
Fundamental Analysis of ConocoPhillips (COP)
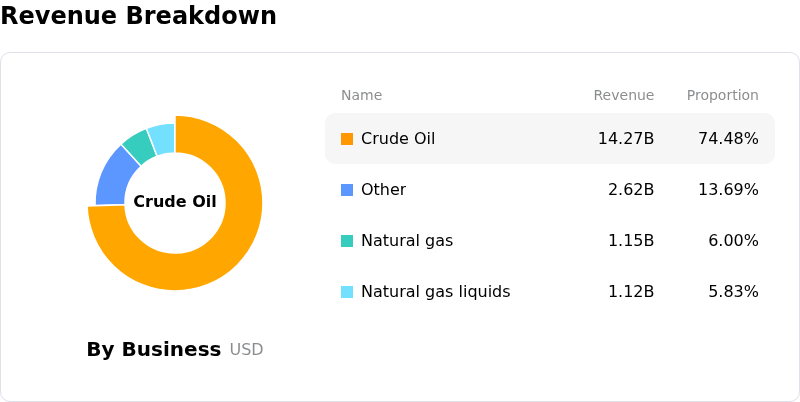
ConocoPhillips (COP) is in the Energy - Fossil Fuels industry. Its latest annual revenue is $58.94B, ranking 13 in the industry. The net profit is $7.96B, ranking 7 in the industry. Company Profile
Over the past month, multiple analysts have rated the company as Buy, with an average price target of $146.18, a high of $189.00, and a low of $119.34.
More details about ConocoPhillips (COP)
Company Specific Risks:
- Elevated Corporate Breakeven and Upstream Sensitivity: Institutional research highlights ConocoPhillips' elevated corporate breakeven level of approximately $53/bbl WTI required to fully cover capital expenditures and dividends, leaving its free cash flow yield acutely vulnerable to downside volatility whenever crude prices pull back following unexpected U.S. inventory builds.
- Substantial Insider Selling and Premium Valuation Drag: Recent trading filings reveal significant net insider selling totaling over $145 million, raising market caution as technical indicators signal overbought conditions and valuation models place the stock above intrinsic fair value estimates ($122.58), triggering profit-taking.
- Geopolitical Headwinds and Mega-Project Execution Risks: Total production declines year-over-year reflect ongoing operational and geopolitical exposures across Middle Eastern assets in Qatar and Libya, while long-dated, capital-intensive projects such as Willow and Port Arthur LNG remain vulnerable to cost overruns and timeline delays.
- Macro Tightening and Capital Expenditure Pressures: A higher interest rate environment and tightening monetary conditions elevate financing costs across capital-intensive E&P producers, prompting analysts to caution that sustained capital spending requirements could compress return metrics if underlying commodity prices weaken.
Nothing in this material constitutes investment advice, personal recommendation, investment research, an offer, or a solicitation to buy or sell any financial instrument. The content has been prepared without consideration of your individual investment objectives, financial situation, or needs, and should not be treated as such.
Past performance is not a reliable indicator of future performance and/or results. Forward-looking scenarios or forecasts are not a guarantee of future performance. Actual results may differ materially from those anticipated.
Mitrade makes no representation or warranty as to the accuracy or completeness of the information provided and accepts no liability for any loss arising from reliance on such information.
Recommended Articles


