



Robinhood Stock Forecast: HOOD Reclaims $116.25 as Tokenization and Prediction Markets Drive Momentum
TradingKey - Robinhood (NASDAQ: HOOD) climbed 9.12% to end the week at $119.82. After making new lows this week, the stock gained on a broader recovery in the tech and crypto sectors. Investors should look for company-specific news to drive the recent upside.
Robinhood's Prediction Markets and Rising Customer Assets should bolster revenue and deserve consideration along with other growth opportunities. Regulation in the U.S. to facilitate the trading of Tokenized Stocks should broaden the company's target market and could provide an inflection point for the stock. Investors should examine if the company can capture this and other market opportunities.
Customer Assets Are Still Compounding Quickly
There were 28.6 million funded customers at the end of August, an increase of 1.9 million from the previous year. Total Platform Assets increased to $384 billion, a gain of 26% from the previous year.
Net deposits for August were $4.0 billion. Over the last 12 months, the company reported approximately $74.1 billion in net deposits, representing a 24% annual growth rate relative to August 2025 Total Platform Assets.
Retaining and attracting customer assets is critical for Robinhood to expand its services and offerings beyond trading commissions. Margin, subscription, cash and investing services, along with banking and other financial products, are potential sources of revenue for the company.
Robinhood continues to experience a high level of trading volume. Notional equity volume for August was $335 billion. Options trading volume was 293 million. Crypto Notional Trading Volume was $17.5 billion.
Gold Is Expanding Robinhood Beyond Brokerage
There were 4.8 million Gold subscribers during Q2, up 39% from last year and 17% of all funded customers. During the quarter, 40% of all newly funded customers signed up for Robinhood Gold.
Gold helps Robinhood expand its product and service offerings, which includes cash products, banking and credit card services. Robinhood Banking had over $3 billion in deposits from more than 240,000 funded customers by the end of Q2, while the Gold Card crossed 1,000,000 customers. Gold Card annualized purchase volume surpassed $17 billion.
This decrease in reliance on variable revenue streams will be increase over time.
Valuation and Regulation Are the Main Risks
Robinhood Markets has made progress improving the business. It is more diversified than in previous years; however, investors have priced earlier period growth potential into the stock price. At its recent price of $119.82, Robinhood Markets' stock is pricing in the growth potential from several different, newer and still-scaling lines of business.
The main threats to Robinhood's growth are use of funds and regulation. There is a great deal of uncertainty concerning the legality of U.S. prediction markets. Cryptocurrency is highly speculative and unpredictable, and the same can be said for tokenization.
I would keep a close eye on net new deposits, Total Platform Assets, revenue from prediction markets, the growth of Gold subscribers, and crypto activity in the next quarter. Also, watch for the company's adjusted operating expenses.
Robinhood Technical Analysis: HOOD Reclaims $116.25 as Bulls Target $125.22
Robinhood closed yesterday at $119.82, very close to the chart price at $119.83. The 1 hour chart has bullish structure and support at $101.81. I like that price has broken through the moving average at $111.24 and the horizontal resistance at $116.25. This targets the September highs.
Rising the bearish dampening RSI is bullish. The RSI is at 73 and the signal line is at 59.
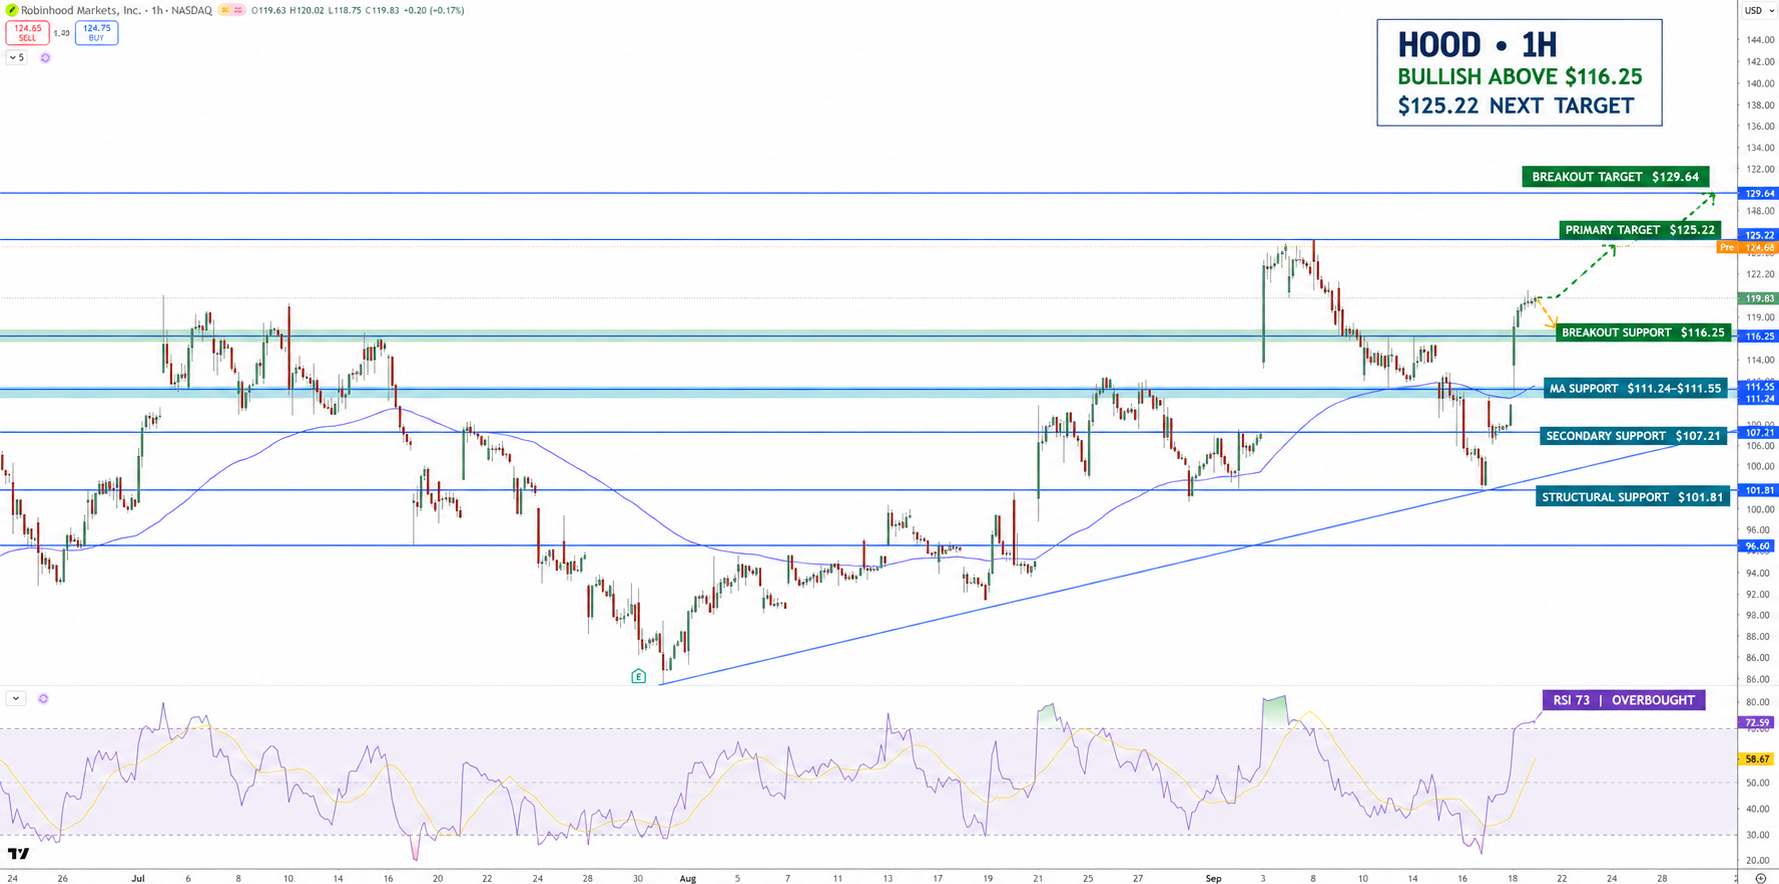
HOOD Price Chart - Source: Tradingview
Because of this I expect price to rally to $125.22. A close above $125.22 would give further upside potential to $129.64. Support is expected at $116.25, $111.55, and $111.24. A break below $111.24 would give further downside potential to $107.21 and the rising trendline at $101.81.
My expectation is for price to continue higher as long as it stays above $116.25. Because RSI is above 70 and in overbought territory, I am looking for price to either break $125.22 or pullback to offer support.
Key Levels
• Latest Completed Close: $119.82
• Major Support Levels: $116.25, 111.55-111.24, $107.21
• Major Resistance Levels: $125.22, $129.64
• Relative Strength Index (RSI): approximately 73, overbought
• Breakout Target: $129.64, if price closes above $125.22
Why is Robinhood stock in focus now?
Robinhood is broadening its business and regulations are changing that may permit tokenized trading of stocks. Additionally, prediction markets, client assets, and other business lines are helping to further Robinhood's business.
What level confirms a stronger HOOD breakout?
HOOD would need to breakout above $125.22 to target $129.64. If support holds at $116.25, it should alleviate downside concerns. Generally, support at $111.24 should help alleviate downside concerns.
Bottom Line
Robinhood is moving beyond being a retail trading app. As a financial platform, predictions on the future markets, expansion of Robinhood Gold, banking, increased customer assets and asset tokenization support the growth outlook.
Deposit growth justifies the trust customers place in Robinhood. This also creates other opportunities for Robinhood to increase revenue.
Regulatory risk and changing levels of trading activity remain key threats. The bullish bias will persist as long as HOOD is above $116.25. A break of $125.22 will likely propel the stock higher to $129.64. A support level of $111.24 will be a key downside level to monitor.
Nothing in this material constitutes investment advice, personal recommendation, investment research, an offer, or a solicitation to buy or sell any financial instrument. The content has been prepared without consideration of your individual investment objectives, financial situation, or needs, and should not be treated as such.
Past performance is not a reliable indicator of future performance and/or results. Forward-looking scenarios or forecasts are not a guarantee of future performance. Actual results may differ materially from those anticipated.
Mitrade makes no representation or warranty as to the accuracy or completeness of the information provided and accepts no liability for any loss arising from reliance on such information.
Recommended Articles


